


Customer’s satisfaction on service quality at Vietnam Technological and Commercial Joint Stock Bank – An Giang Branch
- n Giang University, VNU-HCM (PhD candidate in Business Administration, University of Economics and Law, VNU-HCM), NB105, 18 Ung Van Khiem Street, Dong Xuyen Ward, Long Xuyen City, An Giang Province, Vietnam
- Viet Capital Bank – An Giang Branch, 350 Nguyen Hue Street, Nui Sap Town, Thoai Son District, An Giang Province, Vietnam
Abstract
This study applied SERVQUAL scale of Parasuraman et al to measure factors affecting customer satisfaction on service quality at Vietnam Technological and Commercial Joint Stock Bank - An Giang Branch (Techcombank An Giang). The study was conducted to survey 207 customers who have been using the service at Techcombank An Giang. The survey results were analyzed by the Cronbach’s Alpha reliability test method, then used Exploratory factor analysis (EFA) to verify and evaluate the scale of service quality. The results of the regression analysis show that customer’s satisfaction about service quality at Techcombank An Giang includes four factors: The factor with the highest level is the Empathy with Beta = 0.253, the second of factor is the Responsibility with Beta = 0.248, ranked third in the influence level is the Tangible with Beta = 0.235, and the lowest impact level is the Reliability with Beta = 0.144. The research also uses statistical methods to describe and test the differences of demographic factors with customer’s satisfaction on service quality. The analysis results show that there is no difference between customer’s satisfaction on service quality and factors such as gender, age, income, number of transaction banks, regular transaction banks, and time to use the service at Techcombank An Giang. Through the research results, the author would like to propose some ideas to improve the quality of services, thereby attracting new customers and importantly, keeping traditional customers because the development orientation of Techcombank is to take care of old customers to cross sell other products of the bank. The Stud results offer a basis for the branch to identify the factors influencing customer satisfaction on their service quality, thereby having an appropriate strategy to improve customer satisfaction.
Introduction
The Vietnamese banking system is entering a new competition in service development with the goal of bringing more utilities, based on modern banking technology, to attract customers and minimize risks. It can be said that customer is a decisive factor in the existence and development of banks, so they always consider their customer-oriented business strategy as the most important business strategy.
Service quality is a factor leading to the bank's success, many economists believe that the most competitive trend that shapes the business strategy is service quality. The quality of services helps increase profits, sales, differentiate products, and customer loyalty, thereby have positive feedback. How to satisfy customer satisfaction when their needs are always changing? This is the matter that banks try to deal with all their abilities to grow more and more.
Techcombank - An Giang was established on November 2, 2007 and officially operated on January 11, 2008. During its operation with the goal of maximizing bank profits, the bank has continuously developed and achieved retty good results. However, the low growth rate was due to the low number of customers, which affected the business goals and business results of Techcombank - An Giang. Does the quality of service at Techcombank - An Giang affect the number of customers? This is an issue that needs attention from bank leaders and appropriate solutions. Therefore, researching customer’s satisfaction about service quality at Techcombank is a very important issue that must be conducted regularly to be able to meet customer needs. From there, we can serve our customers in the best way, making them really satisfied when doing transactions at the bank, contributing to the goal that the bank has set. Core values of Techcombank are "Customer First" and "Continuous improvement". They have been striving to improve its operational efficiency and customer service quality to become the number one bank in Vietnam.
Theory
Service and service quality
Due to the complex, diverse and intangible nature of the service, researchers have not yet come up with a unified definition of this concept.
According to Parasuraman, Zeithaml, and Berry (1988)1, service has four important characteristics, greatly influencing the design of effective service operation programs, Intangibility, Heterogeneity, Perishability and Inseparability. ervices are activities or benefits that businesses can offer to customers in order to establish, strengthen and expand long-term relationships and cooperation with customers (Armstrong, Adam, Denize, & Kotler, 2014)2. In recent years, the service concept in the field of quality management has been agreed upon in accordance with ISO 8402: 1999: services are the results created to meet customer’s requirements by contacting activities between suppliers. Supplier's internal and internal operations.
Service quality is a service that meets the needs and expectations of customers. Whether or not the service is good, it does not depend on the service provider through attitudes, behaviors, service spirit, appearance, customer contact, etc. To create good service, there must have an intersection between technical quality and functional quality (Asubonteng, McCleary, & Swan, 1996)3. Although there are many different concepts of service quality, the quality of service includes the following characteristics: superiority, specificity, supply, satisfaction and value creation.
Customer satisfaction
Define
According to Bachelet (1992)4, customer satisfaction is an emotional response of customers to their experience of a product or service. Oliva, Oliver, and Bearden (1995)5 think that the difference, or the relationship of the value of products and services that customers receive compared to previous products and services, will show customer satisfaction. Similarly, Oliver (1997)6 stated that customer satisfaction is the response of consumers to the fulfillment of their wishes. In this view, Zeithaml, Bitner, Gremler, and Pandit (2000)7 claim that customer satisfaction is the evaluation of customers through a product or service that meets their wishes and requirements. This concept specifies customer satisfaction as a measurement based on a product or service. Satisfaction is the level of a person's state, derived from comparing the results obtained from the product and his expectations (Philip, Gary, John, & Veronica, 2001)8. Customer satisfaction is the response of consumers to estimating the difference between previous expectations (or standards for performance) and the actual performance of the product as a accepted after using it (Tse & Wilton, 1988)9. Customer satisfaction is a customer assessment of a product or service that meets the needs and expectations of the widely used SERVQUAL model (Asubonteng et al., 1996)3.
The relationship between service quality and customer satisfaction
Satisfaction and service quality are different but closely related concepts. Service quality is an objective concept that is valuable and aware. Satisfaction, meanwhile, is a combination of subjective components, based on feelings and emotions (Shemwell, Yavas, & Bilgin, 1998)10.Service quality is the most influential factor on customer satisfaction (Cronin Jr & Taylor, 1992)11. Service quality and satisfaction are closely related, in which the quality of service is the one that creates first and then determines customer’s satisfaction.
Research by Zeithaml et al. (2000)7 on the relationship between service quality and customer satisfaction also shows that the overall relationship of satisfaction includes service quality, product quality and price quality. In addition, satisfaction is influenced by situational factors and personal factors. Research by Curry and Sinclair (2002)12 also shows the relationship between service quality and customer satisfaction. Accordingly, if the quality of products or services provided meets customer expectations will lead to customer satisfaction, otherwise, they will lead to customer dissatisfaction. If the quality is improved but not based on the needs of the customer, the customer will never be satisfied with that service. Therefore, when using the service, if customers feel the service is of high quality, they will be satisfied and vice versa. Therefore, the quality of products and services plays an important role in bringing satisfaction to customers.
The service quality gap model of Parasuraman et al
Customers' expectations for service quality are at a distance from their perception of that service quality.
Parasuraman et al. (1988)1 proposed the following five service quality gap model:
- The first gap is the discrepancy between the managers’ perceptions and customers' expectations.
- The second gap is created when the supplier conveys the supplier's perceived expectations to the quality criteria that meet the customer's expectations.
- When the result of service provision is below the standard level, the third distance appears.
- The fourth gap is the discrepancy between the information informed to the customer and the service delivery.
- The fifth gap appears when there is a difference between the expected quality from the customer and the quality they have felt.
This model has the advantage of covering all aspects of the service, but it has the disadvantage of being difficult to evaluate, measure and analyze. Moreover, this model is theoretical, so there may be many components that are not discriminatory, so in 1988, Parasuraman made many adjustments and came to the conclusion that the service quality consisted of five components.
Berry and Parasuraman (1991)13 built the final SERVQUAL scale to evaluate service quality including 22 variables of 5 components to measure the expected quality and perceived service shown as follows: reliability, responsiveness, assurance, empathy and tangible facilities.
However, the use of SERVQUAL needs to be adjusted to suit the different types of services and markets that the study is aiming at, so the number of observed variables and content will change accordingly.
Research model
Research process
Preliminary research (qualitative research) was conducted to establish and complete the questionnaire. The study was conducted through direct survey of customers who have been using the service at Techcombank – An Giang.
In-depth interviews are questions that based on theory and practical information, and used to find more information around research topics. After completing the questionnaire, will check, evaluate the rationality, adjust and complete.
Conducting a formal survey is using a completed questionnaire. The collected data will be carried out for cleaning, coding and conducting analysis.
Research model
There are many models for assessing service quality, of which the most widely used are Expectation model - perceived level (SERVQUAL), Sensitive level model (SERVPERF) and tissue the importance model - the degree of representation, the model of the degree of expectation - the degree of representation (SERVQUAL - Service Quality) proposed by Berry and Parasuraman (1991). SERVQUAL scale measures the perceive through 5 components of service quality (Figure 1), including: (1) Reliability: Demonstrate the ability to deliver appropriate and timely services at the first time; (2) Responsibility: Demonstrate willingness of service staff to provide timely service to customers; (3) Asurance: Demonstrate professional qualifications and courteous and hospitable service to customers; (4) Empathy: Show caring for each individual customer; (5) Tangibles: Expressed through appearance, service attire, equipment to perform the service (Table 1).
Measuring service quality according to SERVPERF model of Cronin Jr and Taylor (1992)11 is considered as a more convenient method, because the questionnaire is concise, saves time and avoids misleading respondents. The downside of this model is that it does not reflect the relationship between user satisfaction and satisfaction and the quality of service provided. Therefore, nowadays studies on customer satisfaction still use SERVQUAL model.
In Vietnam, Loan (2008)14, Đ. P. Hổ (2009)15, Đ. P. Hổ and HUỆ (2019)16 have based on the theory of Berry and Parasuraman (1991)13 to build the model studies the factors affecting customer satisfaction at commercial banks.
The paper will use SERVQUAL to assess and verify the service quality of Techcombank - An Giang.

Research model
The paper will use Liker scale from 1 to five to meansure the Interpret observed variables of the service quality at Techcombank - An Giang (Table 1).
Interpret observed variables in the research model
| Factors | Observed variables | Scale type | |
| Reliability | REL1 | Techcombank strictly follows its commitments | Liker 1 – 5 |
| REL2 | Your information is kept confidential as prescribed | Liker 1 – 5 | |
| REL3 | Techcombank is your trusted bank | Liker 1 – 5 | |
| REL4 | Techcombank makes the first transaction right | Liker 1 – 5 | |
| REL5 | Safety when making transactions at Techcombank | Liker 1 – 5 | |
| Responsibility | RES1 | Processing time at Techcombank is very fast | Liker 1 – 5 |
| RES2 | Staff are always ready to listen, to meet your needs | Liker 1 – 5 | |
| RES3 | taff instructed you to conduct the transaction enthusiastically | Liker 1 – 5 | |
| RES4 | Wide and convenient transaction network | Liker 1 – 5 | |
| RES5 | Staff always answer the phone and email quickly | Liker 1 – 5 | |
| RES6 | Convenient working time | Liker 1 – 5 | |
| Empathy | EMP1 | Staff often ask you about customer service | Liker 1 – 5 |
| EMP2 | Staff treat you properly | Liker 1 – 5 | |
| EMP3 | taff understands your specific needs | Liker 1 – 5 | |
| EMP4 | taff is actively concerned about customer difficulties | Liker 1 – 5 | |
| EMP5 | taff is enthusiastic and friendly | Liker 1 – 5 | |
| Assurance | ASS1 | taff is very happy and enthusiastic when you enters Techcombank | Liker 1 – 5 |
| ASS2 | Staff answered your questions clearly and satisfactorily | Liker 1 – 5 | |
| ASS3 | Staff deal with customers' transactions very quickly and accurately | Liker 1 – 5 | |
| ASS4 | Staff with high professional knowledge | Liker 1 – 5 | |
| Tangibles | TAN1 | Transaction counters are arranged logically and impressively | Liker 1 – 5 |
| TAN2 | Techcombank's equipment is modern and attractive | Liker 1 – 5 | |
| TAN3 | Professional and impressive staff attire | Liker 1 – 5 | |
| TAN4 | Good facilities (toilet, TV, newspaper, drinking water, etc.) | Liker 1 – 5 | |
| TAN5 | Parking is very convenient and safe | Liker 1 – 5 | |
| Satisfaction | SAT1 | You are satisfied with the facilities of Techcombank | Liker 1 – 5 |
| SAT2 | You feel satisfied when dealing with Techcombank | Liker 1 – 5 | |
| SAT3 | You will introduce to your friends about the service at Techcombank | Liker 1 – 5 | |
| SAT4 | You will continue to use Techcombank's services in the future | Liker 1 – 5 | |
Research hypotheses
H1: Tangibles is positively related to satisfaction, meaning the higher the tangible means of service are rated by customers, the higher the satisfaction of service quality and vice versa.
H2: Reliability is positively related to satisfaction, which is the higher the reliability of the service is, the higher the satisfaction of service quality is and vice versa.
H3: Responsibility is positively related to satisfaction, which is the higher the satisfaction of customer service, the higher the satisfaction of service quality is and vice versa.
H4: Assurance is positively related to satisfaction, which is the higher the service capacity of the customer service, the higher the satisfaction of service quality is and vice versa.
H5: Empathy is positively related to satisfaction, which is the higher the value of customer service empathy, the higher the satisfaction of service quality is and vice versa.
Results and Discussion
The survey was conducted in the period from March to April 2019, conducted through the distribution of questionnaires directly to customers who have used the service at Techcombank. As a result, 207 satisfactory surveys of 220 questionnaires were distributed. The data is analyzed and reported.
Sample information by Age
The study results showed that the majority of the interviewees were young people, about 18 to 30 years old, account for 53% (110 people) (Table 2). The age group of 31-40 account for 16% (34 people). Then, the age group from 41-50 years old account for 30% (61 people). And the age group 50 and older is quite small with only 1% (Table 2).
SampleInformation by Age
| Age | Peoples | Percentages |
| From 18 to 30 | 110 | 53% |
| From 31 to 40 | 34 | 16% |
| From 41 to 50 | 61 | 30% |
| From 50 and older | 2 | 1% |
| Total | 207 | 100% |
Sample information by Gender
Sample information by gender
| Gender | Peoples | Percentages |
| Male | 86 | 42% |
| Female | 115 | 58% |
| Total | 207 | 100% |
Based on Table 3, there is a big difference between male and female. Among 207 people surveyed, there were 86 males (accounting for 42%) and 115 females (accounting for 58%) (Table 3).
Reliability test results with Cronbach’s Alpha
Summary results of Cronbach’s Alpha coefficients
| Factors | Scale Mean if Item Deleted | Scale Variance if Item Deleted | Corrected Item-Total Correlation | Cronbach's Alpha if Item Deleted | Cronbach's Alpha |
| REL1 | 17.02 | 4.029 | 0.390 | 0.613 | 0.656 |
| REL2 | 17.45 | 3.744 | 0.330 | 0.644 | |
| REL3 | 17.33 | 3.727 | 0.310 | 0.658 | |
| REL4 | 17.04 | 3.576 | 0.534 | 0.547 | |
| REL5 | 17.20 | 3.580 | 0.529 | 0.549 | |
| RES1 | 21.32 | 6.480 | 0.620 | 0.761 | 0.805 |
| RES2 | 21.49 | 6.319 | 0.616 | 0.761 | |
| RES3 | 21.36 | 6.163 | 0.685 | 0.744 | |
| RES4 | 21.29 | 7.515 | 0.412 | 0.804 | |
| RES5 | 21.26 | 7.242 | 0.470 | 0.793 | |
| RES6 | 21.50 | 6.329 | 0.570 | 0.774 | |
| EMP1 | 15.80 | 6.143 | 0.751 | 0.731 | 0.815 |
| EMP2 | 15.69 | 6.556 | 0.697 | 0.751 | |
| EMP3 | 15.59 | 7.116 | 0.592 | 0.783 | |
| EMP4 | 15.69 | 6.886 | 0.620 | 0.775 | |
| EMP5 | 15.30 | 8.329 | 0.372 | 0.839 | |
| ASS1 | 12.72 | 2.492 | 0.556 | 0.618 | 0.715 |
| ASS2 | 12.57 | 2.799 | 0.538 | 0.633 | |
| ASS3 | 12.38 | 2.888 | 0.469 | 0.671 | |
| ASS4 | 12.48 | 2.775 | 0.451 | 0.684 | |
| TAN1 | 15.87 | 8.081 | 0.668 | 0.806 | 0.842 |
| TAN2 | 16.13 | 6.949 | 0.705 | 0.794 | |
| TAN3 | 16.16 | 6.730 | 0.733 | 0.786 | |
| TAN4 | 15.94 | 7.370 | 0.758 | 0.779 | |
| TAN5 | 15.53 | 9.484 | 0.398 | 0.865 | |
| SAT1 | 12.88 | 2.573 | 0.509 | 0.729 | 0.760 |
| SAT2 | 12.73 | 2.390 | 0.583 | 0.690 | |
| SAT3 | 12.88 | 2.355 | 0.577 | 0.693 | |
| SAT4 | 12.81 | 2.506 | 0.564 | 0.701 |
Cronbach's Alpha if Item deleted REL3 (0.658) is bigger than Cronbach's Alpha (0.656); Cronbach's Alpha if Item deleted EMP5 (0.839) is bigger than Cronbach's Alpha (0.815); Cronbach's Alpha if Item deleted TAN5 (0.865) is bigger than Cronbach's Alpha (0.842) (Table 4). However, the Corrected Item-Total Correlation of REL3, EMP5 and TAN5 is greater than 0.3. So these observed variables are retained for further analysis.
After completing the scale test using Cronbach's Alpha coefficient, the number of observed variables remain 29 variables, and 5 independent variables (Reliability, Responsibility, Empathy, Assurance, Tangibles). The dependent variable is satisfaction.
Results of Exploratory Factor Analysis (EFA)
Cronbach’s Alpha coefficient test results are used for discovery factor analysis (EFA). After four analyzes, the results obtained from the initial 25 observed variables are grouped into 5 factors with 16 observed variables.
The results of EFA for the service quality factors scale
+ The results of EFA – First times
KMO and Bartlett’s tests in factor analysis showed that KMO coefficient is 0.873 > 0.5 with sig significance level. = 0.000. Thus, the factors qualify for EFA.
Based on the results of the sample matrix, the observed variables ASS2, TAN5, REL4, RES5, ASS1 have factor loading < 0.3, so it is not eligible for factor analysis. Based on the results of the total variance explained at the level of Eigenvalues greater than 1, the analysis table is extracted four groups of factors from the 25 observed variables with extracted variance of 60.527% satisfactory because it is greater than 50% (Figure 2).
The results of the first times (EFA) showed that out of 25 observed variables, there were 6 unsatisfactory variables, the remaining 19 variables continued to conduct the second times EFA.

Results of Exploratory Factor Analysis
+ The results of EFA – Second times
KMO and Bartlett’s tests in factor analysis showed that KMO coefficient is 0.856 > 0.5 with sig significance level. = 0.000. Thus, the factors qualify for EFA.
Based on the results of the sample matrix, the observed variables RES3, ASS4 have factor loading < 0.3, so it is not eligible for factor analysis. Based on the results of the total variance explained at the level of Eigenvalues greater than 1, the analysis table is extracted four groups of factors from the 19 observed variables with extracted variance of 55.768% satisfactory because it is greater than 50% (Figure 2).
The results of the second times (EFA) showed that out of 19 observed variables, there were 2 unsatisfactory variables, the remaining 17 variables continued to conduct the third times EFA.
+ The results of EFA – Third times
KMO and Bartlett’s tests in factor analysis showed that KMO coefficient is 0.841 > 0.5 with sig significance level. = 0.000. Thus, the factors qualify for EFA.
Based on the results of the sample matrix, the observed variables ASS3 has factor loading < 0.3, so it is not eligible for factor analysis. Based on the results of the total variance explained at the level of Eigenvalues greater than 1, the analysis table is extracted four groups of factors from the 17 observed variables with extracted variance of 58.325% satisfactory because it is greater than 50%. (Figure 2)
The results of the third times (EFA) showed that out of 17 observed variables, there were 1 unsatisfactory variable, the remaining 16 variables continued to conduct the fourth times EFA.
+ The results of EFA – Fourth times
KMO and Bartlett’s tests in factor analysis showed that KMO coefficient = 0.875 > 0.5 with sig significance level. = 0.000. Thus, the factors qualify for EFA. (Figure 2)
Factor rotation matrix in EFA
| Observed variables | Factors | |||
| 1 | 2 | 3 | 4 | |
| EMP2 | 0.850 | |||
| EMP1 | 0.844 | |||
| EMP4 | 0.717 | |||
| EMP3 | 0.686 | |||
| EMP5 | 0.437 | |||
| TAN3 | 0.847 | |||
| TAN4 | 0.837 | |||
| TAN2 | 0.813 | |||
| TAN1 | 0.748 | |||
| RES1 | 0.789 | |||
| RES 2 | 0.774 | |||
| RES 6 | 0.626 | |||
| RES 4 | 0.542 | |||
| REL1 | 0.771 | |||
| REL5 | 0.667 | |||
| REL2 | 0.618 | |||
Based on the results of the sample matrix, the observed variables have factor loading > 0.3, so it is eligible for factor analysis. Based on the results of the total variance explained at the level of Eigenvalues greater than 1, the analysis table is extracted four groups of factors from the 16 observed variables with extracted variance of 60.243% satisfactory because it is greater than 50%.
After 4 times of EFA, there are 4 groups of factors extracted from the model. (Table 5)
The first group of factors includes 5 observed variables EMP2, EMP1, EMP4, EMP3 and EMP5.
The second group of factors includes 4 observed variables TAN3, TAN4, TAN2, and TAN1.
The third group of factors includes 4 observed variables RES1, RES2, RES6, and RES4.
The fourth group of factors includes 3 observed variables REL1, REL5, and REL2.
The results of EFA for the satisfaction scale
KMO and Bartlett’s tests in factor analysis for satisfaction show that KMO coefficient is 0.723 greater than 0.5, sig significance level. is 0.000 < 0.05. Therefore, the basis of variables is correlated with each other and suitable for EFA analysis (Table 6).
Eigenvalue coefficient of components greater than 1, with extract variance, is 58.182% greater than 50%, so it meets the requirements.
Factor loading of observed variables is greater than 0.4, so it meets the requirement in factor analysis.
Results of EFA of customer satisfaction
| Observed variables | Factor |
| SAT | |
| SAT2 | 0.781 |
| SAT3 | 0.780 |
| SAT4 | 0.767 |
| SAT1 | 0.721 |
| Eigenvalue | 2.327 |
| AVE (%) | 58.182 |
| KMO: 0.781 | Sig. 0.000 |
Regression analysis results
Summary of models
| Models | R | R2 | R2 adjusted | Std. Error of the Estimate | Durbin-Watson |
| 1 | 0.650a | 0.422 | 0.411 | 0.38586 | 1.817 |
Regression analysis results show that the Radjusted is 0.411 means that 41.1% of customer satisfaction variation is explained by 4 independent variables EMP, TAN, RES, REL while 58.9% of customer satisfaction variation is solved by factors outside the model, the remaining other factors have not been studied. The coefficient Sig.F = 0.00 is much smaller than the significance level of α = 5% (Table 7). So, the regression model makes sense, which means that the independent variables influence the dependent variable.
The Durbin-Watson coefficient of the model is 1,817, indicating that the model has no autocorrelation phenomenon (Hoàng & Chu, 2008)17. In addition, the variance magnification (VIF) of variables in the model is many times smaller than 10, so we conclude that the variables included in the model do not have multi-collinear phenomena. The analysis results also show that, among the 4 variables EMP, TAN, RES, REL included in the model, all 4 variables are statistically significant.
Coefficients
| Model | Unstandardized Coefficients | Standardized Coefficients | t | Sig. | Collinearity Statistics | ||
| Std. Error | Beta | Tolerance | VIF | ||||
| (Constant) | 1.268 | 0.278 | 4.555 | 0.000 | |||
| EMP | 0.196 | 0.049 | 0.253 | 3.975 | 0.000 | 0.708 | 1.412 |
| TAN | 0.158 | 0.041 | 0.235 | 3.817 | 0.000 | 0.756 | 1.323 |
| RES | 0.234 | 0.060 | 0.248 | 3.902 | 0.000 | 0.706 | 1.416 |
| REL | 0.146 | 0.060 | 0.144 | 2.431 | 0.016 | 0.812 | 1.232 |
Testing the hypothesis of the suitability of the model by testing F. shows that the F-test has Sig = 0.000, proving that the set linear regression model is suitable for the data set as well as the independent variables in the model, which can explain for the change of the dependent variable.
The regression weight table is considered because the weight β (Table 8) of these variables is statistically significant (Sig. = 0.00 < 0.05). Therefore, variables EMP, TAN, RES, REL have effects on the variable SAT.
Thus, the linear regression equation (Table 8) is rewritten as follows:
SAT = 0.253EMP + 0.235TAN + 0.248RES + 0.144REL
The regression results show that the independent variables EMP, TAN, RES, REL having Beta coefficients, respectively, 0.253; 0.235; 0.248; 0.144 all have positive signs, so all variables have the same effect with customer satisfaction on service quality at Techcombank – An Giang.
It can be concluded that the suitability of theoretical model for the data, and hypotheses H1, H2, H3, H4 are accepted. The results show that there are 4 independent variables with significant effects on the dependent variable (sig < 0.05). And the remaining 4 factors included in the regression analysis are retained in the model.
Current status of customer satisfaction on service quality at Techcombank – An Giang
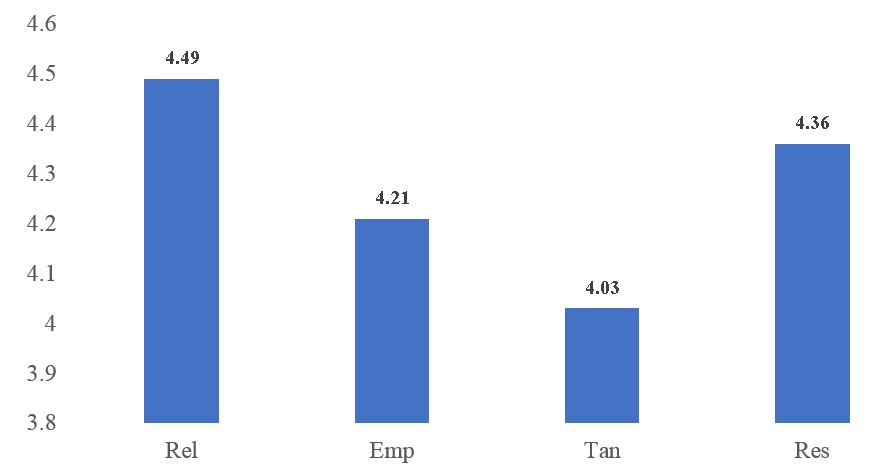
Current status of customer satisfaction on service quality at Techcombank – An Giang
Through Figure 3, customers highly appreciate Techcombank's service quality with an average of 4.03 to 4.49, of which customers rated the reliability best (average 4.49). This shows that this is a strength of Techcombank – An Giang because of the reputation and outstanding service quality make customers highly satisfied (Figure 3).
Along with the reliability, the responsiveness, also highly appreciated, ranked second with an average value of 4.36, shows that service efficiency is also a strength that Techcombank needs to pay attention to maintain customers' trust.
Ranking third in customer evaluation is the average sympathy of 4.21, which is quite a high number, proving that customers are also very satisfied with the attentive, and care that Techcombank’s employees distributed. Therefore, the bank needs to have training and remuneration policies for employees to improve customer satisfaction for Techcombank – An Giang.
Although ranked lowest among the four scales, the tangible vehicle component is rated at a high level (average of 4.03) with modern facilities. This proves that Techcombank's service quality is relatively good and meets the needs of customers.
Conclusion
The results of the current situation analysis of factors affecting customer satisfaction show that reliability is the highest rated customer with an average of 4.49. The second most appreciated factor is the responsiveness with an average of 4.36, not much different from the reliability factor. The third most appreciated is the empathy with the average of 4.21. The lowest rated element is the tangible means with an average of 4.03, but still high.
Besides, the regression analysis results (Table 8) show that the level of impact of 4 factors on customer satisfaction, in which empathy (0.253) has the largest impact on customer satisfaction, has second most significant effect is responsibilities (0.248), ranking third in terms of influence is tangible means (0.235), and finally reliability (0.144) having the lowest influence among the four factors.
In summary, the research results have basically achieved the initial goal of analyzing the factors affecting customer satisfaction when using services at Techcombank – An Giang.
Through the research results, the author would like to propose some ideas to improve the service quality, thereby, attract new customers and the important thing is to keep traditional customers because the development orientation of Techcombank – An Giang is to take care of old customers to cross sell other products of the bank as follows:
Improve satisfaction with the element of Empathy
Pay attention to customers during the transaction process with dedicated service, customer inquiries, and affable attitude. Staff should try to remember the customer's name as much as possible, which makes customers feel appreciated.
The bank should allow employees to attend training courses on communication skills, customer care and understanding, which will help customers feel confident when using the service at the bank.
Improve satisfaction with the element of Responsibility
It is necessary to simplify the procedures, automate the execution, and ensure accuracy and timeliness to minimize customer transaction time and build trust in customers.
Expand the transaction network on the provincial area to facilitate the transaction needs of customers in the province.
Improve service quality based on customer feedback. Feedbacks from customers should be respected, preferably thanks.
Improve satisfaction with Tangibles
Banks need to invest in the appearance of transaction offices, especially in the layout of luxurious, neat space, eye-catching design, a convenient and safe parking lot.
In addition, a table of water with a vase and a few magazines introducing banks, a few small services while waiting for transactions are also an effective way to hold customers.
Improve satisfaction with the reliability
Improving bank's reputation is a top priority. It takes a long period of time to gain customers' trust, to build and retain customers.
Enhance the sense of banking security in the minds of customers such as investing in facilities, carrying out accurate transactions, making financial transparency and effective business.
Update information quickly, promptly and accurately, and provide complete information quickly to customers.
ABBREVIATIONS
ASS: Assurance
AVE:Average
EFA: Exploratory Factor Analysis
EMP: Empathy
KMO: Kaiser-Meyer-Olkin (KMO) Test
REL: Reliability
RES: Responsibilities
SAT: Satisfaction
Sig: Significant
TAN: Tangibles
ACKNOWLEDGEMENT
The authors would like to thank the Board of Directors, and the entire staff for Techcombank An Giang for supporting the team to complete this study.
CONFLICTS OF INTEREST
The authors declare that they have no conflicts of inerest
AUTHORS’ CONTRIBUTION
The content of the article is studied by the authors:
Tran Minh Hieu: Study the revision of the research model, write a draft of the results, and review the final results.
Nguyen Duong Ngoc Mai Chi: Support for reviewing, surveying data, analyzing results and writing reports.