


The relationships of technology readiness, perceived value, satisfaction, and continuance intention – A study of self-service technologies in Viet Nam
- School of Industrial Management, HCMC University of Technology
Abstract
Technologies have changed the way of doing business remarkably. The marketplace is being replaced by market space, where almost all products/services are embodied in digital forms and delivered through information-based channels. As a result, this study attempts to investigate the determinants of marketspace marketing, particularly of self-service technologies. More specifically, the study examines the relationships among technology readiness, perceived value, customer satisfaction, and continuance intention in using self-service technologies. Data was collected through a questionnaire survey on 179 users who have had experience in using self-service technologies (including internet banking, airline ticket online booking, and tours online booking) in Ho Chi Minh City –Vietnam’s largest city. Partial least squares structural equation modeling (PLS-SEM) was used to analyze the data. The results show that all of the six hypotheses were empirically supported. Specifically, (1) Technology readiness has a strong positive influence on perceived value, customer satisfaction, and continuance intention; (2) Perceived value shows a moderate positive impact on satisfaction and continuance intention; (3) Satisfaction has a significant positive impact on continuance intention. In terms of theoretical contributions, this study proposed a value-based framework to predict continuance intention and conceptualized technology readiness as a second-order formative construct, which better represents the content of the construct originally developed by Parasuraman (2000). In terms of managerial implications, marketing managers should pay special attention to TR when making decisions such as launching new SSTs, segmenting customers, or boosting customers’ TR.
Introduction
Nowadays, technology plays an increasingly important role in delivering services. Parasuraman and Colby 1 claimed that technology has revolutionized service development and delivery in virtually every service category. For example, instead of queuing in long lines to check out at supermarkets, customers now can buy a lot of things with just a click at their homes via e-commerce webpages. Traditional marketplace has been gradually replaced by marketspace which is featured as information-based channels and information digitalization 2. This trend leads to the emergence of self-service technologies (SSTs), or service encounters that help customers to produce services regardless of service employment involvement2. While SSTs bring about a lot of benefits such as more flexibilities of time, space or efforts in consuming services, customers may consider, for instance, some phone self-services as time consuming or confusing 3. In the same vein, until recently, despite technological change is pervasive, little is certain about customers’ readiness to continue using, for example, mobile self-service in airline industries4.
Extant work in technological based services in general and SSTs in specific has much focused on technology readiness (TR),5 and more, on perceived usefulness and ease of use, the two primary factors of the well-known TAM model by Davis6 to investigate how individual customers are ready to adopt and continue using newly developed service systems7. While TR is necessarily included in prior studies as it is to represent consumers’ enduring propensities to embrace various new technologies1, TAM constructs are somehow questioned in consumer settings where the adoption is not imposed under the objectives of an organization7. Hence, our present paper attempts to shed light on this gap by using consumer value theory rather than TAM constructs to develop a research model that simultaneously employs consumer TR, perceived value and satisfaction for predicting continuance intention of SSTs. The consumer behavior literature identifies consumer value as a crucial antecedent of their choice and decision making relating to purchase behaviors 9, 8. Meanwhile, we also deliberately include consumer satisfaction into the model because, from marketing view, satisfaction is usually considered as a key to maintaining customer loyalty, or continuance intention10.
The paper is structured as follows. Next is the part of theoretical backgrounds and hypothesis development. Then is the research methodology followed by the findings. Theoretical contributions and managerial implications are discussed in the final section.
Literature review
Conceptual background
Self-service technologies (SSTs)
Wang et al.11 noted that the development of technology has dramatically change the nature of service encounters which has traditionally conceptualized as “high-touch and low-tech”. Many traditional interpersonal encounters have been supplemented or even replaced by technological interfaces such as self-service technologies11. SSTs are defined as technological interfaces that enable customers to produce a service without direct involvement of service employees2. ATMs, self-checkout machines at supermarkets, vending machines, internet banking, online hotel booking are some examples of SSTs. Meuter et al.2 classified SSTs’ interfaces into four types, namely telephone-based (e.g. telephone banking), internet-based (e.g. online shopping), kiosk-based (e.g. ATMs), and Video/CD based (e.g. CD-based training). Companies use SSTs for three purposes such as customer service, transaction, and self-help2.
From customers’ perspective, SSTs enable them to enjoy the service more flexibly, independent of time and space2. Customers’ acceptance to using SSTs is determined by their cost saved, ease of use, usefulness and self-control12. For service providers, Wang et al.11 posited that while the introduction of SSTs can help companies reduce labor costs and reach new customer segments, their lack of interpersonal contact might lead to reduced customer loyalty.
Technology Readiness
Technology readiness (TR) is defined as “people’s propensity to embrace and use new technologies for accomplishing goals in home life and at work” 1. Technology can trigger both negative and positive feelings, but the relative dominance of the two types of feelings can vary across individuals5. Accordingly, people can be arrayed on the continuum anchored strongly positive to strongly negative, and their positions in this continuum correlate with their propensity to embrace and use new technology5. Based on this conceptual underpinning, Parasuraman and Colby1 developed a multiple-item scale to measure readiness to use new technologies which is called Technology Readiness Index 2.0 (TRI2.0). The TRI2.0 consists of 16 items which are classified into four dimensions: optimism, innovativeness, discomfort and insecurity. In this index, optimism and innovativeness are considered as drivers of TR while discomfort and insecurity are inhibitors of TR. In terms of the motivators, while optimism is understood as a positive view of technology to facilitate people to have increased control, flexibility, and efficiency in their lives, innovativeness is defined as a tendency to be a technology pioneer and thought leader. For the inhibitors, discomfort is understood as a feeling of being overwhelmed by, and a perceived lack of control over technology whilst insecurity is defined as distrust of technology and skepticism about its ability to work properly. Accordingly, a customer who is optimistic about the benefits of a new technology or is innovative finds a new technology useful and easy to use13. Meanwhile, customers who are high in discomfort and insecurity in TR can find it difficult to use and enjoy new technologies13. This study employs TRI2.0 and treats it as a second-order formative index since the four dimensions are assumed to measure independent constructs which in combination cause the latent construct14.
Consumer Satisfaction
Consumer satisfaction has received a lot of attention in marketing literature. Barreda et al.15 posited that researchers perceived service-related customer satisfaction from two approaches: comprehensive assessment or transaction-specific result. This study operationalized satisfaction as “the summary psychological state” as in the study of Chen et al.16. Accordingly, consumer satisfaction is defined as a “function of expectation and expectancy disconfirmation” which can lead to attitude change and purchase intention17. Specifically, satisfaction is the summary of psychological state resulting when the emotion surrounding disconfirmed expectations is coupled with the consumer’s prior feelings about the consumption experience16. Lin and Hsieh 18 believed that satisfaction is “an evaluation of an emotion”, which reflects the degree to which a consumer believes that the possession and/or use of a service evokes positive feelings. Chen et al.16 noted that service literature shows evidence for the significant impacts of satisfaction on behavioral intentions.
Perceived Value
Customers’ perceived value is considered as the core construct and foundation in a relational exchange 19. Perceived value is defined as the consumer’s overall assessment of the utility of a product based on perceptions of what customers receive and what customers give up to acquire that product 8. Woodruff 20 also describes that the perceptions of value typically involve a trade-off between what is received and what is given. Employing these definitions, this study defines perceived value as the assessment of the trade-off between gains and losses in the repurchase process in terms of time, money and effort as in Sirdeshmukh et al.21.
Continuance Intention
Information technology continuance has become an emerging area in information system (IS) research over the past ten years 22. Expectedly, while acceptance is understood as first time use, continuance refers to continued use 23. It should be emphasized that sustained use rather than initial acceptance will determine the long-term viability and eventual success of any IS 22.
On the other hand, from the perspective of social psychology, individual behavior is consistently resulted from people’s intentions related to that behavior (see, for example,24). Moreover, users’ intention to use was long considered as one of the fundamental drivers of their usage behavior in a lot of empirical studies in behavior research in general (for example, see25). Hence, in this paper, for the sake of simplicity, continuance intention is adopted to study rather than continuance use. Following Bhattacherjee23, continuance intention is defined as user’s intention to continue using an IS, and in this study, it is understood as customer’s behavioral intention to continue using any SST.
Hypotheses
The effects of TR on customer satisfaction, perceived value, and continuance intention
The literature of IS continuance has centered on the expectation-confirmation theory (ECT) that indicated that consumers reach a purchase intention in the following steps: (1) form initial expectation about the product/service, (2) accept, purchase or use the product/service if they perceive it as useful, (3) compare perceived performance with their initial expectation to form confirmation, (4) base on confirmation to form a level of satisfaction, (5) form a repurchase intention or discontinue subsequent use 26. People with high TR are “willing and ready to use new technology”5, so they can have better performance in using SSTs than those with low TR. This better performance can lead to the confirmation of their expectation on which customer base to form their satisfaction. Lin and Hsieh 18 found that TR is “an important driver of SST-satisfaction”. Some empirical studies also proved the positive impact of optimism and innovativeness dimensions of TR on satisfaction (see28, 16, 27). Therefore, it is hypothesized:
H1: TR has positive impact on customers’ satisfaction in using SSTs
Perceived value is the overall assessment of what is received and what is given8. Customers have to give some resources such as time, money, and effort in order to acquire a service 29. Especially, SSTs, which require customers to produce service without involvement of service providers, are perceived as more risky than interpersonal transactions 30, so they may require more time and effort to use. TR refers to “the customer’s propensity to embrace and use new technologies for accomplishing goals in home and work life”, so people with high TR are willing and ready to use new technologies 5. Ho and Ko 12 proposed that people of high readiness level toward technology are enthusiastic and thus result in high level of value evaluation, while the reverse is true for people with low level of readiness. Therefore, it is hypothesized:
H2: TR has positive impact on customers’ perceived value in using SSTs
The underpinning of TR is that people can be positioned on the continuum anchored by extremely negative and extremely positive about new technologies5. When consumers are positive about a new technology, they feel optimistic and want to be among the first people to embrace the new technology5. On the contrary, the feelings of discomfort or insecurity would inhibit consumers from using the new technology5. As a result, it is argued in this study that people with high TR will continue using new technology, while people with low TR will avoid using it again. The higher a customer’s TR is, the more they have favorable behavioral intentions towards SSTs31, 18. Therefore, it is hypothesized:
H3: TR has positive impact on customers’ continuance intention in using SSTs.
Perceived value, customer satisfaction and continuance intention
Customer perceived value is the customer’s overall trade-off assessment of the salient sacrifice and benefits8. Wang32 noted that perceived value has received much attention in economics and marketing on both academic and practitioner level because of its important role in predicting purchase behaviors and achieving sustainable competitive advantage. According to utilitarian approach proposed by Mill33, when customers have to make decisions, the usually decide by comparing the difference between costs and benefits. Accordingly, if the benefits are greater than the costs, customers are likely to make positive purchase decision. In a study of internet banking, Ho and Ko12 concluded that consumer value (including functional, social and epistemic value) is determinant factor affecting continuance intention. Therefore, it is hypothesized that:
H4: Perceived value has positive impact on customers’ continuance intention in using SSTs
Customer satisfaction is formed based on the confirmation of expectations as mentioned above in the ECT. Meanwhile, perceived value is the assessment of gains and losses. In other words, when people have high perceived value, their expectation is confirmed and thus they feel more satisfied with the service. The relationship between perceived value and customer satisfaction in post purchase behaviors has been proved in other contexts (see35, 34). Therefore, it is hypothesized that:
H5: Perceived value has positive impact on customers’ satisfaction towards SSTs
Customer satisfaction and continuance intention
It should be noted that the ECT holds that consumers’ intention to repurchase products or continue service use is mainly determined by their satisfaction with their past use or purchase experience25. Bhattacherjee and Lin 22 empirically pointed out that satisfied consumers might have much more intention to continue to use IS. Lin and Hsieh 7 also confirmed that the more satisfaction customer experience in using IS, the more likely they are to use it again and recommend it to others. Literature has shown a number of empirical studies which proved the positive impact of satisfaction on continuance intention in the context of SSTs (see36, 28, 27, 16). Therefore, it is hypothesized that:
H6: Customer satisfaction has positive impact on customers’ continuance intention towards SSTs
Figure 1 shows 06 hypotheses of the study.
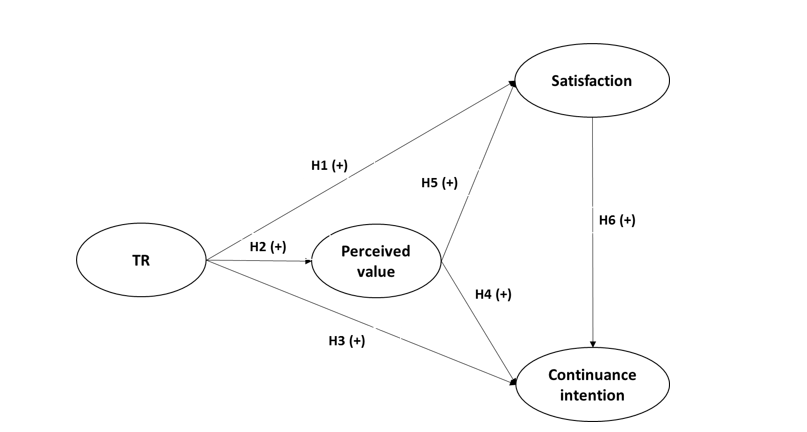
Research model.
Methods
Sample design
The sample comprised 179 cases surveyed from consumers who have used SSTs from the service companies located in HCMC, a commercial and trading hub in Vietnam economy. The service categories adopted were some forms known as hi-tech and low contact and hence were of typical SSTs37, including e-banking and online payments (banking and financial services), flight booking and check-in online (airline) and online reservations of hotel and restaurants (hospitality). Data were obtained by means of a structured questionnaire with a convenience sampling. The surveys were delivered to the branches of 4 banks in the area (Dong A, Sacombank, ACB, VIP bank), the agencies of 3 airline companies (VNA, Jetstar, Vietjet) and 3 online travel agencies in HCMC (iVIVU.com, mytour.vn, booking.com). Both offline and online forms were employed in which the questionnaires in paper were sent to the customer service departments of the corresponding service providers, and the questionnaires in Google documents were put into the associated fan pages of the service provider websites.
The total response of over 400 was received over 2 months of questionnaire delivery. Finally, after removing the responses of excessive missing information, 179 valid responses were ready for consequent analysis. Of the entire valid sample, 54.9% were female and 45.1% male; 45.2% were between 18 and 25 years old, 40.4% between 26 and 35 years old, and the rest from 35 years old; 40.3% were in e-banking and online payments, 11.2% in flight booking and check-in online and 45.5% customers in online reservations of hotel and restaurants.
Measurement
All measurement items of theoretical constructs were adapted from previous studies where the scale psychometric properties were well established. Originally prepared in English, the questionnaire was then translated into Vietnamese with the help of two bilingual university faculties. The scale of perceived value (PV) was adopted from Sweeney et al.38, of consumer satisfaction (CS) and of continuance intention (CI) from Bhattacherjee et al.39. In specific, technology readiness (TR) is a second-order formative construct consisting 4 dimensions, namely optimism, innovativeness, discomfort and insecurity, which were derived from Parasuraman and Colby’s 1 TRI2.0 and Chen et al.’s28. All the scale used a five-point Likert one, anchoring from 1 (totally disagree) to 5 (totally agree), except for customer satisfaction, which was measured with three items based on a five-point semantic differential scale.
Data analysis
Using the software package ADANCO 1.140, the paper employed the variance-based SEM technique. There were two reasons for our choice of PLS approach. First, it has little restrictions of sample size and distribution 41. Second, PLS is also a well-established technique in various literatures including marketing, management, information systems and more 42. This study did run the bootstrapping with 4999 resamples 41 to estimate the measurement and structural model. Following Henseler 40, the study assessed the research model in the two-stage approach. The first stage is to obtain variable scores of only the first order constructs, no including the second-order construct. In the second stage, the model containing the second-order construct is estimated with the scores of the first order constructs used as indicators of the second-order.
Results
Measurement model
Table 2, Table 1 show the assessment of the measurement model containing only the first-order constructs and the dimensions of the second-order construct. The construct reliabilities were acceptable with the fact that all composite reliability (CR) values are ranging from 0.709 to 0.852 (greater than 0.7). The convergent validity of the instrument was also assured as the factor loadings are ranging from 0.614 to 0.823 (greater than 0.6), and average variance extracted (AVE) values from 0.530 to 0.770 (all greater than 0.5) (cut-off values by 41).
It should be noted that the CRs shown here are Dijkstra-Henseler's rho (ρA), the more consistent measure of internal reliability as suggested by Henseler et al. (2016). The discriminant validity of the constructs was satisfactory when the square roots of average variance extracted are greater than the correlation between two latent constructs 41 (Table 2).
To assess multicollinearity, we employed variance inflation factor (VIF) technique with the threshold of 5 below41. All VIFs ranging from 1.174 to 2.952 indicates that no problem of multicollinearity is found.
Scale items and loadings
| Constructs | Standardized factor loadings |
| Optimism (OPT) | |
| Technologies allow me to work more efficiently. | 0.6931 |
| Technologies make my life easier | 0.7891 |
| Technologies give me more opportunities | 0.7728 |
| Learning how to use the technology could bring me a lot of benefits | 0.7834 |
| Innovativeness (INNO) | |
| My relatives would like to learn new technologies from me | 0.6934 |
| I almost see no problems when using high-tech products/services | 0.7462 |
| I am usually the first one to acquire new technologies among my friends | 0.8136 |
| I can understand the new high-tech products/services by myself | 0.7524 |
| Discomfort (DISCOM) | |
| It takes me more time to employ high-tech products/services, comparing to other products/services | 0.6184 |
| Use of new technologies is often a challenge to me. | 0.7391 |
| The manual of high-tech products/services is not easy to understand. | 0.7535 |
| Using high-tech products/services often requires more of my efforts | 0.8310 |
| Insecurity (INSEC) | |
| I think it is not secure to provide personal information on Internet. | 0.6884 |
| I think it is not safe to do sensitive transactions online. | 0.8330 |
| I am worried about the information I sent over the Internet would be employed by others. | 0.7571 |
| I am often concerned about transactions that could only be done online | 0.6139 |
| Perceived value (VAL) | |
| The service I experienced at X was a good buy | 0.8513 |
| The price of services provided at X is at the right level, given the quality | 0.8608 |
| It is worth experiencing services at X | 0.8922 |
| Satisfaction (SAT) | |
| How you do feel about your overall experience with services at X? | |
| Extremely dissatisfied/satisfied | 0.8611 |
| Extremely displeased/pleased | 0.9237 |
| Extremely frustrated/contented | 0.8458 |
| Continuance intention (INT) | |
| If I could I would like to continue using services at X for my near future demands | 0.6641 |
| I expect my use of services at X to continue in the near future | 0.8044 |
| I intend to continue to use services at X | 0.8473 |
| I will frequently purchase services at X in the future | 0.8748 |
Reliability and validity of scales at first-order level
| Construct | Composite reliability | Opt | Inno | Discomf | Insec | VAL | SAT | INT |
| Opt | 0.7584 | 0.5785 | ||||||
| Inno | 0.7694 | 0.1799 | 0.5667 | |||||
| Discomf | 0.7474 | 0.1573 | 0.1949 | 0.5468 | ||||
| Insec | 0.7090 | 0.1840 | 0.2158 | 0.3435 | 0.5295 | |||
| VAL | 0.8518 | 0.3924 | 0.1502 | 0.2492 | 0.3044 | 0.7700 | ||
| SAT | 0.7823 | 0.3163 | 0.0926 | 0.1567 | 0.2034 | 0.3320 | 0.6870 | |
| INT | 0.8244 | 0.3407 | 0.0829 | 0.2465 | 0.2833 | 0.3788 | 0.4706 | 0.6428 |
For the formative construct, followed Hair et al.41 ’s procedure, measure properties evaluated (Table 3) showed that the scale of TR was acceptable with all indicator weights are statistically significant (t-statistic greater than 1.96). Finally, in the case of the measurement model including TR as the second-order construct, the assessment results are shown in Table 4. It should be noted that, at Henseler’s 40 guidelines, the following two-stage approach was employed with the fact that TR as a second-order construct: (i) the model comprising only first-order constructs is assessed first to extract the construct scores; and (ii) the model containing the second-order construct (TR) is evaluated with the construct scores of first-order constructs as indicators of the second-order construct (TR). In summary, the measurement model exhibits an adequate fit with the gathered data.
Measure properties of the formative construct of TR
| Weight (t-statistic) | VIF | |
| Opt | 0.3989 (14.1133) | 1.4739 |
| Inno | 0.2234 (7.1491) | 1.3578 |
| Discom | 0.3209 (12.3306) | 1.5787 |
| Insec | 0.3461 (15.8543) | 1.8827 |
Reliability and validity of scales at second-order level
| Constructs | Composite reliability | TR | VAL | SAT | INT |
| TR | - | - | - | ||
| VAL | 0.8519 | 0.4482 | 0.7700 | ||
| SAT | 0.7821 | 0.3306 | 0.3320 | 0.6872 | |
| INT | 0.8195 | 0.4075 | 0.3799 | 0.4734 | 0.6427 |
Structural model

Results of model test.
Note: ***p < 0.001; **p < 0.01; *p < 0.05; a: weights; b: loadings
(Hair et al., 2014; Petter et al., 2007)
Figure 2 shows that the model is fit with the gathered data, which was assessed on (i) path estimates have statistical significance and (ii) determined coefficient R of explanatory power of the model is of high enough value41.
The overall result indicated that all of 6 hypothesized paths were empirically supported at significance level of 5%. As may be expected, TR had strong impacts on perceived value, satisfaction, and continuance intention with path estimates of 0.670, 0.343, and 0.264 respectively. In addition, both perceived value and satisfaction had impact on continuance intention with path coefficients of 0.196 and 0.424 in order.
Concerning the explanatory power via the determined coefficient R, technological readiness and perceived value jointly accounted for 39.7% variance of satisfaction which in turn, along with perceived value and technological readiness accounted for 58.1% variance of continuance intention. These results demonstrated that the model has good prediction power41.
Discussion
The present work makes four theoretical implications. First, in terms of the key antecedents of continuance intention, while many prior works (e.g. 43) have exploited perceived usefulness, which was drawn from well-known TAM to mainly reflect a technology adopter view, this study has employed perceived value instead. In the marketing literature (e.g. 8), value, a trade-off between total benefits and total costs, has principally been used to guide customer choices. In other words, perceived value is formed by evaluating gains and losses after consumer experiences the service. That is because, as Bhattacherjee and Lin 22 indicated that in continuance contexts, consumers tend to ascribe more faith in their actual comprehensive experiences (i.e. perceived value) than in their expectations of only benefits (e.g. perceived usefulness). Thus, from the consumer perspective, perceived value seems to be more robust than perceived usefulness to predict consumer behaviors, including consumer intention to repurchase SSTs.
Second, as grounded in ECT, while satisfaction with IS use was key predictor of continuance intention, satisfaction in turn was chiefly determined by users’ confirmation of expectation from their use38. In spite of suggesting an underlying for consumers’ perception on IS use, confirmation is inherently limited with the fact that it presents only expected benefits of use, not denoting failure to achieve expectation, or disconfirmation equivalently. At this point, our value-based framework, considering both benefits and costs of use, may provide a significantly alternative predictor for satisfaction.
Third, comparing to the widely-cited TRAM model (i.e. TR and TAM combination) where TR was a global measure (see 7), or to some previous studies in which TR was presented as 4 single sub-constructs (e.g. 28) or posited as second-order reflective construct (e.g.44), our conceptualization of TR as a second-order formative construct may be a better representation for the theoretical content of TR as originally suggested by Parasuraman5. Fourth, in terms of the outcomes of consumer TR, while a great deal of previous papers focused on cognitive assessment (as perceived usefulness in7), or both cognition and emotions (as in45, the influence of TR on customer perceived value, an overall assessment of experiencing product/service (8, seemed to have not yet been investigated in the technology adoption and SSTs literature.
Conclusion
The study aim at empirically investigating the relationships among TR, perceived value, satisfaction and continuance intention in the context of SSTs. The result from 176 cases show that all of 6 hypotheses were empirically supported at significance level of 5%. Specifically, TR had strong impacts on perceived value, satisfaction, and continuance intention with path estimates of 0.670, 0.343, and 0.264 respectively. Both perceived value and satisfaction had impact on continuance intention with path coefficients of 0.196 and 0.424 in order.
Managerial implications
Our findings provoke some important implications for SSTs managers. First, it is essential that the firms conduct surveys to find out their consumers’ level of TR before launching new SSTs. It is a waste of money if firms launch a new SST when their customers are not ready to use it. Second, firms can segment their customers in order to have suitable strategies to support their customers in using SSTs. For example, firms can organize training courses or incentives for “hesitators” and “avoiders’, challenging activities/experiences for “explorers” and “pioneers” to try new technologies, or communication activities for “skeptics”. Third, firms can strengthen their customers’ TR through marketing activities. For example, firms can design SSTs interface as simple and friendly as possible, or firms can promote technology knowledge through commercials, workshops, training courses, etc. Fourth, with the finding that satisfaction is the strongest driver of continuance intention, firms should pay their attention to increase customer satisfying evaluation of using SSTs. Some measures would be, given no service personnel during normal service delivery, providing online guidelines/manuals, organizing web forums for customer knowledge sharing, or promoting service design of user orientation to improve especially users’ first-hand experience with SSTs.
Future research
Consumer satisfaction, perceived value, and continuance intention play central role in marketing. This study has made an attempt to explain these attitudes and behaviors using the concept of consumer TR, which is receiving much attention from researchers, especially in technology adoption and SSTs. The results show that TR is strong drivers of perceived value, satisfaction, and continuance intention. However, with the fact that TR centers on an individual’s personality5, subsequent studies may exploit TR as both antecedents and moderators in the relationships among these important marketing constructs.
The present work is from the individual consumers’ view of SSTs and hence, opens up a vast space for further studies investigating technology-based services in business-to-business domain where technology readiness at firm level, implying firm inclination to embrace new technologies5, is also believed to have impacts on, for example, collaborative business relationships in hi-tech business environments46. Finally, instead of utilizing a unidimensional approach to perceived value as in this paper, it is worth for next studies to employ a multi-dimensional operationalization of consumer value because seeking for fun, pleasure, happiness, or even social value is present in consumers’ decision of consumption of services in general19.
List of abbreviations
SSTs: Self-service technologies
TR: Technology Readiness
TAM: Theory of Acceptance Model
ECT: Expectancy Confirmation Theory
HCMC: Ho Chi Minh City
Conflict of interest declaration
The authors have declared that no competing interests exist.
Author contribution
The two authors have contributed equally to the study.