


Bank credit and trade credit: The moderating role of financial constraints
- University of Economics and Law, Ho Chi Minh City, Vietnam
Abstract
Trade credit is an important source of financing, and its proper management is essential to the survival and thriving of firms. Meanwhile, bank credit also plays as a critical funding source, especially in the setting of developing and emerging markets with high level of information opaqueness and low institutional quality. The current research examines the determinants of accounts payable using a sample of 590 firms listed in Vietnam from 2015 to 2022, focusing on the choice between bank credit and trade payables. We utilize panel data estimation methods, including the fixed effects model (FEM) and the random effects model (REM). The study provides evidence supporting the substitution effect between banks’ short-term and long-term loans and trade credit. Therefore, it is evident that many firms, when granted access to bank loans, exhibit a propensity to favor borrowing from banks rather than relying on accounts payable. The study differs from other similar studies by examining both short-term and long-term loans, rather than just short-term bank financing. Furthermore, the analysis of the moderating effect of financial constraints reveals that firms that less financially constrained firms seek more bank credit than trade credit. Again, this emphasizes the priority for bank loans over supplier financing, as well as the role of bank credit in a bank-based financial market such as Vietnam. We also find that cash holdings, annual revenue growth rates and firm size are significantly related to trade credit use. The results are robust throughout several robustness checks and the effort to control for the potential endogeneity issue. Based on the research findings, we offer implications for relevant stakeholders on managing of external financing, including both bank and interfirm financing.
Introduction
Firms need financial resources for their production and investment activities. However, firms have difficulties in sourcing their financial resources. In developing countries, firms do not have many official financing options 1. The lack of financing options induces firms in these economies to rely on credit granted by banks and suppliers. In fact, bank debt and trade payables collectively account for a fairly high proportion of the balance sheet.
Bank credit is provided in various forms, ranging from short-term loans, overdrafts, and invoice discounting, to long-term loans. The credit is granted following creditworthiness evaluation based on numerous factors, including information from firms’ financial statements to the lender. Meanwhile, trade credit is provided by suppliers through payment extensions (typically between 30 and 90 days). The literature stresses that trade credit could be a helpful source of funding in an environment plagued with information asymmetry that compromises banks’ ability to properly evaluate creditworthiness properly2, 3, 4, 5. Compared to banks, suppliers do not find information asymmetry a serious issue, since they make decisions based on the intimacy grown through the repeated behaviour of customers.
Choosing between trade payables and bank credit is not always straightforward. Companies can meet their financing needs with bank credit to keep financing costs low, provided it is available. They may turn to trade payables when bank financing is inaccessible, indicating a substitution effect between payables and bank credit2, 6, 7. Alternatively, companies can adopt a diversification strategy, using both bank and supplier credit to maintain a mix of funding sources. This way, they can rely on the other if one source becomes unavailable. In this scenario, payables and bank debt cover additional financial needs are covered proportionally, reflecting a complementary approach to financing8, 9. The extra cost of using both sources can be seen as a premium to avoid financial constraints.
Because of its specific nature of not belonging to the banking sector, trade credit is not highly regulated by authorities. Trade credit is essential for entities facing challenges in accessing credit institutions and capital markets 10, 11, 12. However, payables can be an expensive source of finance for firms. García-Teruel and Martínez-Solano 13 document that UK firms face tradeoffs while using trade credit and in fact have a target level of accounts payable, and that larger firms with better access to alternative financing rely less on supplier credit. Abuhommous14 also finds that Jordanian firms have a target accounts payable ratio. Luo15 finds that the Covid-19 pandemic pressures firms that use account payables, so firms need to adjust to their target payable ratio even faster.
Investigating whether the relationship between bank credit and trade credit is supplementary or substitutive is crucial. Furthermore, it is essential to find whether the financial constraint moderates the link between bank credit and account payables. In other words, does financial constraint motivate firms to use both bank and trade credit, thus enhancing their complementary effect between them? Or, do less financially constrained firms with easier access to bank loans try to take more on this source of financing, rather than supplier credit?
In Vietnam, the financial market is still fledgling with low institutional quality and weak corporate governance 1. Therefore, creditors might hesitate to lend because of high information asymmetry and weak creditor protection. In this setting, the role of trade credit as a substitute for bank credit could be more substantial. At the same time, as firms have few financing options, the two financing sources could be used together to fill the financing gaps. Therefore, in a developing country with a bank-based financial market such as Vietnam, the link between the two types of financing remains complex, yet lacks empirical examination is lacking. In this research, we use a sample of listed firms in Vietnam from 2010 to 2022 to investigate the link between the two funding sources of funding to see which expectation is more realistic in this economy. We expand the literature by examining not only the link between short-term loans and payables, but long-term loans. Typically, long-term loans have not been studied in previous studies as both payables and short-term loans are more related to short-term operations. In our study, we build hypotheses to test the relationship between bank loans (including both short- and long-term ones) and trade payables to offer a more well-rounded view, at least in the context of a developing country as Vietnam. Finally, we also examine the other determinants of the use of trade credit to understand more comprehensively the nature of trade financing in this country.
After the introduction, the research continues as follows. Section 2 presents the literature review on which hypotheses are built. Section 3 presents the research methodology comprising empirical models, variable construction, and estimation strategies and research sample. Section 4 provides the estimation results and discussion, which we base on the implications in Section 5.
Literature review and hypothesis development
The relationship between bank credit and trade credit
Bank loans have been identified as an important factor in both developed and developing countries 16. It is offered after creditworthiness evaluation based on the borrower's past performance. However, some level of information asymmetry exists between corporate insiders and outsiders, which limits banks' capacity to evaluate firms’ creditworthiness 5, 17 correctly. Firms plagued by information asymmetry often have difficulty obtaining bank loans, especially during financial crises.
This lack of bank credit may induce firms to consider trade credit as a substitute source of financing18, 19, 20. In contractionary periods, suppliers generally have fewer difficulties facing information asymmetry due to the intimate knowledge about a regular buyer and the ability to repossess and redeploy the goods sold 21. Hence, suppliers with low financing costs could provide the much-needed trade credit to financially limited purchasers to nurture a long-term relationship 12, 22. This phenomenon can be referred to as the “redistribution” effect.
Numerous studies have investigated the benefits of trade credit. One of the primary advantages of trade credit for purchasers is that the granted period buys them time to evaluate the product's quality13, 23. The buyer can decline payments if the faulty products result in decreased transaction costs. Obtaining trade credit with favourable terms and conditions helps lower overall borrowing costs24, 25. Furthermore, firms can match their payments to suppliers with customer, eliminating the gap between cash inflow and cash outflow. As a result, the cost of managing inventory would be reduced. Financially constrained firms typically use trade credit to address excessive costs and the unavailability of capital market funding arising from asymmetric information. Importantly, trade credit is shown to help enable the survival of firms in financial crises 22, 26, 27.
However, if firms do not make use of the early discount facility, trade credit can be an expensive source of financing28, 29. High cost is the reason why firms prefer short-term bank loans, and only when firms cannot obtain more bank loans will they resort to trade credit, creating what is called a “pecking order” in the choice of financing sources.
Determinants of trade payables
Short-term bank loans
The firm's accounts payable level is influenced by its ability to secure external financing, including short-term bank loans. Trade credit is generally more expensive than bank credit due to higher direct costs of funds 17, 29. Consequently, firms with easy access to bank loans tend to rely less on trade credit. This aligns with the pecking order theory for short-term funding sources, where firms prioritize bank credit to minimize financing costs and only resort to trade credit when bank loans are not available. Furthermore, studies by Petersen and Rajan 29, Chen et al. 4, Bussoli et al. 22, and Psillaki & Eleftheriou7 provide evidence of the substitution effect, indicating a negative relationship between payables and short-term loans.
On the other hand, firms may follow a financing diversification strategy, using both payables and bank loans to avoid the danger of funding sources drying up 8. The diversification motive is further supported by Tsuruta 30, Lawless et al.31 and Kestens et al. 32. The studies point to a complementary effect rather than a substitution relationship between trade payables and short-term bank loans. Despite the fact that trade credit demands additional expenses, firms may regard it as an "insurance premium". The diversification strategy might benefit firms with high levels of constraints 8, 20. Trade credit helps to reduce liquidity risk33 and alleviate financial difficulties during crises.
Because there are reasons to expect both positive and negative links between accounts payable and short-term debt, we establish the first two hypotheses as follows:
Hypothesis 1a: There is a positive association between short-term loans and account payables.
Hypothesis 1b: There is a negative association between short-term loans and account payables.
Long-term bank loans
Garcia-Teruel & Martinez-Solano 34 argue that companies with access to bank loans tend to exhibit reduced reliance on trade credit, because trade credit is more expensive than bank credit. This is consistent with the research results of Rodriguez-Rodriguez 35 and the findings of Petersen and Rajan29 for small US firms, which implies that firms that generate more resources internally tend to rely less on supplier debt. Short-term loans are a more relevant determinant in the case of payables, since accounts payable refer to the funds owned by suppliers that have to be paid within a year. However, since banks also provide long-term debt, its effect on trade credit should also be examined. Garcia-Teruel & Martinez-Solano13 find that long-term bank loans negatively relat to accounts payable in Belgium, Finland, France, Greece, Spain, Sweden and the UK.
Consequently, in this research, we use the same hypothesis regarding their linkage with trade payables for both long-term and short-term loans.
Hypothesis 2a: There is a positive association between long-term loans and account payables.
Hypothesis 2b: There is a negative association between long-term loans and account payables.
Cash holdings
Although firms could delay the repayment to their suppliers, trade credit obligations must be honored. Late supplier credit payments result in costs, including the price discounts, the likelihood of encountering late payment penalties and the resulting deterioration in credit reputation36. Wu et al. 36 uncover a positive effect of trade payables on cash holdings in China, with firms holding an additional $0.71 in cash for every $1 of credit payable. Consistently, Abdulla et al. 37 consistently show that cash holdings positively impact trade credit.
However, Chaieb 38 suggests that holding cash has a negative and statistically significant effect on the cost of debt. In other words, this implies that the higher liquidity a company maintains, the lower its cost of debt. In situations with substitution effect between financial debt and account payables, firms are likely to hoard more cash to reduce the cost of debt.
Consequently, since there are potentially two directions of the effect of cash holdings on trade payables, we propose the following hypothesis:
Hypothesis 3: There exists a significant association between cash holdings and account payables.
Size
Large and reputed firms are generally considered as less risky, and tend to have superior financial conditions, access to loans, creditworthiness, and bargaining power than smaller firms23, 34, 39, 40. The size of the buyer firm can impact the terms of trade credit. As a result, we can anticipate a positive correlation between size and trade payables, as suppliers are more inclined to extend credit to large firms with favourable terms and conditions.
On the contrary, large firms could use less vendor credit, since they have better access to other sources of financing sources due to higher creditworthiness and reputation41, 42. Moreover, Atanasova43 and Coricelli & Frigerio 44 argue that small firms suffer stricter credit limits and consequently rely on supplier credit as financial resources. If a substitution effect exists between bank credit and trade credit, we should witness a negative correlation between size and trade payables.
Based on two potential opposite relationships, the hypothesis is proposed below:
Hypothesis 4: Size is associated with accounts payable.
Inventory holdings
Fisman & Love 45 illustrate the utilization of trade credit varies among industries but remains relatively consistent within industry. Industries, such as technology service firms and restaurants lacking tangible inventories, have a limited need for trade credit. This differentiates them apart from industries that heavily relying on tangible inventories46. Inventories directly affect a firm’s trade credit policy 47.
Naturally, Caglayan et al. 48 naturally find a positive correlation between trade payables and inventories, suggesting that firms tend to increase their inventories and trade payables when purchasing on credit from suppliers. Similarly, Cunat 49 and Yazdinejad & Jokar 50 identify a positive relationship between inventories and trade payables, arguing that firms with higher inventories tend to have higher trade payables since inventories can be collateral. Interestingly, Fernandez et al. 51 document a negative relationship between the two factors.
Therefore, a positive relationship between trade payables and inventories is anticipated.
Hypothesis 5: There is a positive relationship between inventory holdings and accounts payable.
Sales growth
Previous studies by Garcia-Teruel & Martinez-Solano 34 and Petersen & Rajan 29 provide a theoretical perspective, suggesting that firms with growth opportunities tend to seek more financing from suppliers, resulting in a positive correlation between sales growth and accounts payable.
Sales growth has a notable impact on trade payables 52. Firms that are more vulnerable to market imperfections are more likely to use more trade credit to manage growth. Cunat 49 suggests that fast growing firms can rely on trade payables when other sources of finance are not sufficiently available. Fisman & Love 45 argue that industries that utilize trade payables grow faster in poorly developed financial markets.
We posit that obtaining more trade credit is necessary for firms to invest in projects with growth potential, especially in Vietnam, a relatively young financial market. As a result, we propose the following hypothesis:
Hypothesis 6: There is a positive relationship between sales growth and accounts payable.
The impact of financial constraint on the link between bank credit and accounts payable
A firm's accessibility to bank credit is affected by its size and asset tangibility. Firms with more tangible assets may have greater access to external funds 53. Large firms tend to have higher creditworthiness and better access to capital markets compared to small firms41, 42. Size and tangible assets can be regarded as factors that help firms benefit more from bank credit, thus increasing the levels of short-term debt. Therefore, firms with higher levels of size and asset tangibility should have better access to bank loans at better terms and conditions, thus being less financially constrained and reducing the need for trade credit.
The hypothesis is represented as follows:
Hypothesis 7: Financial constraints tend to increase the negative effect of bank credit on on accounts payable.
Research methodology
Empirical model
The research employs the following baseline model to evaluate the hypotheses from H1 to H6:
Paya = β + βSize + βShortdebt + βLongdebt + βCash + βInventory + βSalegr + a + Ɛ
The research employs the following model to evaluate the hypothesis from H7:
Paya = β + βSize + βShortdebt + βLongdebt + βCash + βInventory + βSalegr + βFC*Shortdebt + βFC*Longdebt + βFC*Cash + a + Ɛ
Where: Paya is the dependent variable, measured as the ratio of trade payables to total assets34, 37. Size is the logarithm value of total assets34, 54. Shortdebt is the main variable of interest, measured as the ratio of bank loans of less than one year to total assets. Longdebt is another main variable of interest, measured as the ratio of bank loans of more than one year to total assets34, 55. Cash is the proxy for cash holdings, measured as the ratio of cash holdings to total assets37. Inventory is the variable representing the level of inventories, measured as the ratio of total inventories to total assets49, 45. Salegr is the annual growth rate of revenue34, 55. FC is the financial constraint variable, proxied by size and asset tangibility. The interaction variables formed between FC and bank credit, and cash are included to evaluate the hypothesis H7. a is the individual effect, and Ɛ is the residual.
Research sample and estimation strategies
The research employs a panel dataset covering 590 firms listed in Vietnam from 2010 to 2022. The financial data are retrieved from the Thomson Refinitiv database. We remove firms with fewer than three years of observation due to extreme values are likely to be attached to these cases. The final data comprises 3,658 firm-year observations.
We employ panel data estimation methods, including fixed effects model (FEM) and random effects model (REM). As panel data have individual effects, these methods are more appropriate than Ordinary Least Squares (OLS). To further ensure the robustness of the research findings, we employ random effects with industry dummies to control for the characteristics of the industry on the tendency to use trade payables 45. Finally, we try to address potential endogeneity issues emanating from the two-way relationship between the dependent and independent variables, in this case the choice between trade and bank credit could be simultaneously determined56. All the models have been tested for the existence of problematic multicollinearity through the Variance Inflation Factor test 57. All the VIF values are lower than 4, indicating that the models are not subject to high level of multicollinearity.
Research results and discussions
Descriptive statistics and correlation matrix
Table 1 presents the descriptive values of the variables in the model. Paya on average accounts for approximately one tenth of the total assets. Shortdebt’s mean value is to somewhat similar to that of Paya, indicating that the two sources of financing might play equal roles in corporate capital structure. Longdebt has a higher mean of 13.85 percent. Compared to Luu & Nguyen 55, who examined listed firms in Vietnam from 2011 to 2019, we have a similar value of Paya, but a smaller value of Shortdebt and a higher value of Longdebt. This could be due to the effect of Covid-19 that makes long-term lending much more risky for banks.
Cash is also close to Paya, with hortdebt and Longdebt values. Inventory, on average, accounts for one-fifth of the total assets. Salegr is not favorable, with a negative value of 0.2 percent. This could be due to the effect of Covid-19 outbreak that negatively affects the performance of firms in Vietnam.
Descriptive statistics of the variables
|
Variable |
Obs |
Mean |
Standard deviation |
Min |
Max |
|
Paya |
3,658 |
0.1093 |
0.1014 |
0.0000 |
0.9057 |
|
Shortdebt |
3,658 |
0.1181 |
0.1462 |
0.0000 |
0.7638 |
|
Longdebt |
3,658 |
0.1385 |
0.1606 |
0.0000 |
0.7981 |
|
Cash |
3,658 |
0.1247 |
0.1288 |
0.0001 |
0.8828 |
|
Size |
3,658 |
27.8336 |
1.5659 |
23.5902 |
33.9896 |
|
Inventory |
3,658 |
0.2135 |
0.1757 |
0.0000 |
0.8589 |
|
Salegr |
3,658 |
-0.0017 |
0.4986 |
-7.5548 |
1.0432 |
Table 2 presents the pairwise correlation coefficients of variables in the model. We can see that Shortdebt is positively linked to Paya, while Longdebt is negatively related to Paya. Cash is negatively related to Paya, suggesting a substitution effect rather than the argument that firms prepare cash to pay vendors. Large firms tend to use less vendor financing, supporting substitution effect. As firms have more inventory, they use more trade financing to support the associated costs. Overall, we can see evidence to support the dominating substitution effect, except for the positive correlation between Paya and Shortdebt. However, it is crucial to note that the correlation coefficients refer only to the association between two variables, without considering the other covariates, and this can easily lead to biases in estimating coefficients. Therefore, it is important to proceed with multivariate regressions to verify the hypotheses established above.
Correlation matrix
|
Paya |
Shortdebt |
Longdebt |
Cash |
Size |
Inventory |
Salegr | |
|
Paya |
1.0000 | ||||||
|
Shortdebt |
0.1110 |
1.0000 | |||||
|
Longdebt |
-0.1589 |
-0.3907 |
1.0000 | ||||
|
Cash |
-0.1065 |
-0.1244 |
-0.1821 |
1.0000 | |||
|
Size |
-0.1265 |
0.0456 |
0.2189 |
0.0073 |
1.0000 | ||
|
Inventory |
0.1530 |
0.2934 |
-0.1689 |
-0.2062 |
-0.0066 |
1.0000 | |
|
Salegr |
0.0422 |
0.0134 |
0.0539 |
0.0113 |
0.0512 |
0.0010 |
1.0000 |
Regression results and discussion
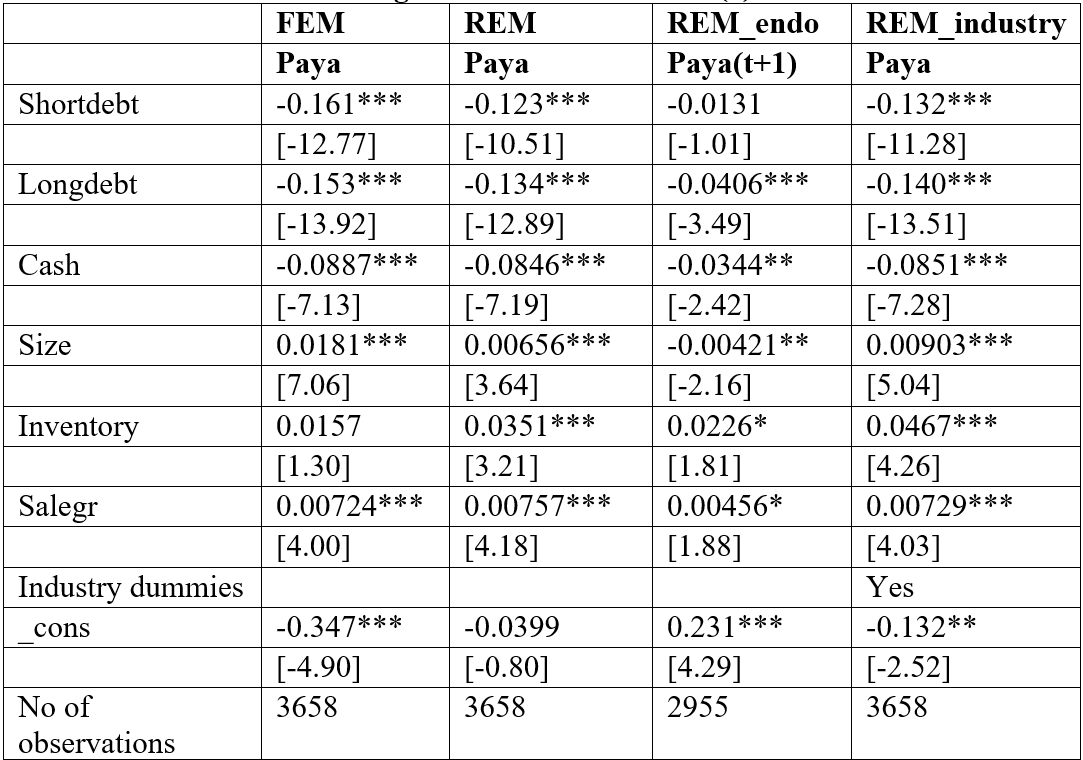
Table 3 displays regression results using the Fixed Effects model (FEM), Random Effects Model (REM), REM with endogenous treatment (REM_endo), and REM with industry dummies. As previously discussed, we make an effort to address the potential endogeneity issue emanating from the two-way relationship between the dependent and independent variables, in this case the choice between trade and bank credit could be simultaneously determined 56. We use the one-period lead value of Paya (Paya), rather than the current value of Paya, as the dependent variable.
From Table 3, Shortdebt is generally negatively and significantly related to Paya, suggesting that firms tend to consider the two sources of financing as substitutes. Trade credit is more expensive than bank credit17, 55, 58. Therefore, firms with easy access to bank loans rely less on trade credit to save funding costs for short-term needs34, in line with the hypothesis 1b.
It is interesting to see that even though Vietnam is a young financial market with few financing options, firms still want to use less vendor credit, if they can use more short-term bank loans. This result also nullifies the diversification motive established in the research by Tsuruta30 and Kestens et al. 32. Therefore, in Vietnam, firms tend to view bank credit and vendor credit as substitutes, rather than complements, and ignore the insurance premium effect.
With regard to Longdebt, we also find negative and significant coefficients in all four columns. Even though debt of longer maturity is not meant to support short-term financing needs, there is evidence of some substitution effect between long-term bank loans and accounts payable, supporting the hypothesis 2b. This result is in line with the study of Luu & Nguyen 55 in Vietnam. The findings for Shortdebt and Longdebt variables suggest that even though Vietnam is a market plagued by information asymmetry and low institutional quality, commercial banks, through their extensive networks and huge volume of credit granted, can squeeze information effectively.
For the Cash variable, we also witness a negative relationship between cash holdings and accounts payable, in line with the hypothesis 3. This result negates the view that firms prepare cash to pay trade credit as in Wu et al. 36 and Abdulla et al. 37. Meanwhile, Chaieb 38 suggests that abundant cash helps lower the cost of debt, and while we document that there is a negative linkage between bank loans and trade credit, it is natural to expect that firms prioritize more debt in their capital structure and hoard more cash to reduce the cost of debt.
For Inventory and Salegr, these two variables are positively relate to Paya, consistent with the hypotheses 5 and 6. Caglayan et al. 48 find a positive correlation between trade payables and inventories, indicating that firms tend to rely on vendor financing to fund inventories. Cunat 49 identifies a positive relationship between inventories and account payables, arguing that firms with higher inventories tend to have higher trade payables as inventories can serve as collateral. Garcia-Teruel & Martinez-Solano 34 and Petersen & Rajan 29 provide a theoretical perspective, suggesting that firms with growth opportunities tend to gain more financing from suppliers, resulting in a positive correlation between sales growth and accounts payable. Growth opportunities are quite intangible and usually cannot serve as collaterals; as a result, firms might have to resort to the support from their suppliers, rather than banks to fund their expansion.
Regression result of model (1)
|
FEM |
REM |
REM_endo |
REM_industry | |
|
Paya |
Paya |
Paya(t+1) |
Paya | |
|
Shortdebt |
-0.161*** |
-0.123*** |
-0.0131 |
-0.132*** |
|
[-12.77] |
[-10.51] |
[-1.01] |
[-11.28] | |
|
Longdebt |
-0.153*** |
-0.134*** |
-0.0406*** |
-0.140*** |
|
[-13.92] |
[-12.89] |
[-3.49] |
[-13.51] | |
|
Cash |
-0.0887*** |
-0.0846*** |
-0.0344** |
-0.0851*** |
|
[-7.13] |
[-7.19] |
[-2.42] |
[-7.28] | |
|
Size |
0.0181*** |
0.00656*** |
-0.00421** |
0.00903*** |
|
[7.06] |
[3.64] |
[-2.16] |
[5.04] | |
|
Inventory |
0.0157 |
0.0351*** |
0.0226* |
0.0467*** |
|
[1.30] |
[3.21] |
[1.81] |
[4.26] | |
|
Salegr |
0.00724*** |
0.00757*** |
0.00456* |
0.00729*** |
|
[4.00] |
[4.18] |
[1.88] |
[4.03] | |
|
Industry dummies |
Yes | |||
|
_cons |
-0.347*** |
-0.0399 |
0.231*** |
-0.132** |
|
[-4.90] |
[-0.80] |
[4.29] |
[-2.52] | |
|
No of observations |
3658 |
3658 |
2955 |
3658 |
Table 4 presents the regression results for Model 2, i.e., Model 1 with interaction variables between financial constraints (FC) and bank credit. First, we use Size to guage the level of financial constraint. Compared to Model (2) suggested in Section 3, we remove the individual variables Size, Shortdebt and Longdebt, because the Variance Inflation Factor test indicates that including of these variables leads to serious multicollinearity among the regressors.
The results align with Table 3 for Cash, Inventory and Salegr. Specifically, Inventory and Salegr are positively related to Paya, indicating that firms with higher inventories and revenue growth rates tend to rely on vendor financing. On the other hand, if firms exhibit a stronger preference for bank credit than trade credit, they could hold more cash to reduce the cost of debt, leading to a negative correlation between cash holdings and accounts payable.
Importantly, the interaction variables (Size*bank credit) have negative and significant coefficients. Larger firms tend to experience more substitution effects between bank credit and trade credit. This provides evidence supporting the hypothesis H7: for firms that are not less financially constrained, they will seek more bank credit, rather than trade credit. Increasing bank credit, especially short-term debt, could lead to bankruptcy risk; however, this risk is less problematic for large firms. At the same time, a higher level of bank credit might indicate that firms can access official financing at a favorable conditions. Previous studies also confirm that firms generally prefer bank credit, and only if bank credit is limited will they switch to trade credit55.
Regression result of model (2) – FC = Size
|
FEM |
REM |
REM_ind |
REM_ind_endo | |
|
Paya |
Paya |
Paya |
Paya(t+1) | |
|
Cash |
-0.0849*** |
-0.0830*** |
-0.0828*** |
-0.0363*** |
|
[-6.78] |
[-7.04] |
[-7.06] |
[-2.58] | |
|
Inventory |
0.0132 |
0.0338*** |
0.0450*** |
0.0392*** |
|
[1.08] |
[3.09] |
[4.09] |
[3.14] | |
|
Salegr |
0.00768*** |
0.00780*** |
0.00763*** |
0.00473* |
|
[4.21] |
[4.29] |
[4.20] |
[1.95] | |
|
Shortdebt*size |
-0.00464*** |
-0.00388*** |
-0.00399*** |
-0.00102** |
|
[-10.71] |
[-9.56] |
[-9.89] |
[-2.27] | |
|
Longdebt*size |
-0.00489*** |
-0.00447*** |
-0.00454*** |
-0.00189*** |
|
[-12.56] |
[-12.27] |
[-12.54] |
[-4.67] | |
|
Ind dummies |
[2.38] |
[3.37] | ||
|
_cons |
0.152*** |
0.139*** |
0.120*** |
0.0929*** |
|
[33.52] |
[25.28] |
[7.70] |
[6.13] | |
|
No of observations |
3658 |
3658 |
3658 |
2955 |
To complete the analysis, Table 5 presents the regression results for Model 2, with asset tangibility being used to indicate the level of financial constraint. Tang is measured as the ratio of the net value of property, plant and equipment to total assets. We find that the results are similar to those in Table 4. This again confirms the validity of the hypothesis H7: for firms that are not less financially constrained, they will seek more bank credit, rather than trade credit.
Regression result of model (2) – FC = Tang
|
FEM |
REM |
REM_ind |
REM_ind_endo | |
|
Paya |
Paya |
Paya |
Paya(t+1) | |
|
Cash |
-0.0903*** |
-0.0860*** |
-0.0879*** |
-0.0394*** |
|
[-7.02] |
[-7.13] |
[-7.33] |
[-2.76] | |
|
Inventory |
0.00339 |
0.0194* |
0.0308*** |
0.0316** |
|
[0.27] |
[1.73] |
[2.76] |
[2.51] | |
|
Salegr |
0.00686*** |
0.00702*** |
0.00674*** |
0.00435* |
|
[3.72] |
[3.83] |
[3.68] |
[1.80] | |
|
Shortdebt*Tang |
-0.124*** |
-0.0963*** |
-0.112*** |
0.000474 |
|
[-6.04] |
[-5.10] |
[-5.89] |
[0.02] | |
|
Longdebt*Tang |
-0.148*** |
-0.126*** |
-0.140*** |
-0.0589*** |
|
[-9.81] |
[-9.61] |
[-10.48] |
[-4.02] | |
|
Ind dummies |
[1.30] |
[2.92] | ||
|
_cons |
0.140*** |
0.129*** |
0.133*** |
0.0983*** |
|
[31.79] |
[23.80] |
[8.27] |
[6.19] | |
|
No of observations |
3658 |
3658 |
3658 |
2955 |
Conclusion and implications
The current research examines the determinants of accounts payable of 590 firms listed in Vietnam from 2015 to 2022. Vietnam serves as an appropriate research setting since it is a developing country with a young financial market plagued by information asymmetry and inadequate protection of the rights of debtholders. In this setting, trade credit, or vendor financing, could be more significant role in providing the much-needed funding for firms’ operations.
Our study provides consistent evidence supporting the substitution effect between bank loans and trade credit, with bank loans being considered at short and long-term maturity. In the context of Vietnam, it is evident that many firms, when granted access to bank loans, tend to favor borrowing from banks rather than relying on accounts payable. This result is highly consistent with the previous results on the stronger preference for bank credit, and only when bank credit is limited in contractionary periods would firms switch to vendor financing. Further analysis of the moderating effect of financial constraints reveals that firms that are less financially constrained firms seek more bank credit, rather than trade credit. Again, this emphasizes the preference for bank loans over supplier financing in the context of Vietnam.
Based on the findings regarding the priority for bank loans, the implications could be for suppliers to, perhaps, provide more attractive offers to the buyer firms or for the latter to take advantage of the discount provided through early payments. As for the banks, to serve as the chief source of funds in the economy, banks can collaborate with suppliers to utilize the information collected by the latter in the process of creditworthiness verification. This would benefit both the banks and suppliers.
Future studies can delve into moderating the effect of other factors, like the country’s governance. This avenue has not been exploited in the literature.
ABBREVIATIONS
FC – Financial constraint
FEM – Fixed Effects Model
OLS – Ordinary Least Squares
REM – Random Effects Model
TDNH – Tín dụng ngân hàng
TDTM – Tín dụng thương mại
CONFLICT OF INTEREST STATEMENT
The authors declare that they have no conflicts of interest
AUTHOR CONTRIBUTIONS
Liem Nguyen is responsible for hypothesis development, data curation and regression estimation.
Anh Tran is responsible for writing the introduction and hypothesis development.
Tien Pham is responsible for writing the results and discussions.
An Le is responsible for writing the results and discussions.
Thy Le is responsible for writing the conclusion.
Viet Nguyen is responsible for writing the conclusion.
All members are responsible for proofreading the manuscript.