


The export competitiveness of Vietnam tuna industry in the global market: Evidence from revealed comparative advantage and constant market share of harmonized system code 6-digit products
- Faculty of International Economic Relations, University of Economics and Law, Vietnam National University Ho Chi Minh City, Ho Chi Minh City, Vietnam
- Faculty of International Economic Relations, University of Economics and Law, Ho Chi Minh City, Vietnam
- Viet Nam National University Ho Chi Minh City, Vietnam
Abstract
Export competitiveness is essential to a country's global success. In this study, we assess the competitiveness of Vietnam's Tuna industry compared to its major competitors (Ecuador, Indonesia, Taipei – China, and Thailand) in the most significant world tuna-importing regions (ASEAN, Japan, the Middle East, the EU, and US) at four detailed industry codes, namely fresh or chilled tuna (0302:31, 32, 33, 34, 35, 35, 36, 39), frozen tuna (0303:41, 42, 43, 44, 45, 46, 49), filets (0304-87), and preserved tuna (1604:14). The analysis is based on the secondary data from the International Trade Centre database (Trade Map/COMTRADE) and the UNCTAD stat database in period 2007-2019, using the RCA (Revealed Comparative Advantage) and the CMS (Constant Market Share) analysises. The RCA reveals that Vietnam's competitiveness in exporting 0302 tuna declined significantly after 2012, especially in the US and Japanese markets, while competitors like Ecuador and Taipei (China) capitalized on the market. The CMS shows that although the competitiveness effect had different values in each market, it tended to remain the same. For Tuna 0303: The RCA value declined significantly across all markets, especially evident in the Middle East; meanwhile, competitors like Ecuador held a significant advantage in key markets like the EU. Results from CMS show that the demand for Vietnam's tuna 0303 decreased. Besides, for the commodity composition effect, from period I-II, its value increased sharply, but when entering period III, it started to decrease. The market distribution effect fluctuates strongly. For Tuna 0304: The RCA reveals that Vietnam dominated the export of 0304 tuna in all markets, with a consistently high RCA value. The standard world growth effect value increased considerably. Vietnam's market distribution and competitiveness affect positive growth in all markets except the ASEAN. For the prepared or preserved tuna product (1604), its comparative advantage in the US, Japan, EU, and Middle East markets was average and tended to decrease. Only in the ASEAN market did Vietnam have a relatively high comparative advantage. In general, a comparison with crucial competitors shows that Vietnam's level of competitiveness is similar due to the influence of resources, market demand, and technological capacity, but Vietnam holds a competitive edge in tuna exports in key markets. An investment policy is being implemented to assist fishermen, including procuring novel, high-capacity vessels outfitted with fishing equipment and facilities designed to enhance quality preservation. Furthermore, ongoing endeavors are to enhance fish consumption and foster collaborations between the fishing sector and fishermen. In addition, there is a focus on enhancing fisheries logistics services to reduce expenses before exporting to global markets.
Introduction
Export competitiveness (EC) is a means to achieve global competitiveness 1, 2, 3. The term EC pertains to the capacity of a country or region to effectively create and possess markets, as well as generate profits, in foreign marketplaces where its products are traded 4. In the past thirty years, the research on EC has achieved remarkable advancements and garnered recognition as a distinct concept5. There have been endeavors to construct theoretical frameworks encompassing certain aspects of EC6, 7. Besides, EC was assessed at different levels, including the product level 8, firm level 9, 10, regional level11, industry level 12, 13, and country level14, 15, 16, 17. However, in previous studies, commodity EC was examined at an aggregate level5, 18. A practical issue of utmost importance for a country with a substantial agricultural sector is maintaining sustainability and increasing its agricultural products' international competitiveness8, 15, 17. The tuna export industry has been one of the critical structural sectors in Vietnam over the past 15 years, accounting for 21.56% of total seafood exports in 2021, playing an essential role in the global value chain, with 5.0% of the total tuna exported worldwide. However, Vietnam's tuna export value is only about 35.0% of Thailand's and Indonesia's, but Indonesia, Vietnam, and Thailand have similar advantages in this industry. The research landscape regarding the competitiveness of Vietnam's tuna export industry presented a noticeable disparity compared to other countries in the region and the whole world 19, 20.
This study aims to determine Vietnam's tuna industry's current position and competitiveness in comparison with its major competitors (Ecuador, Indonesia, Taipei – China, and Thailand) in the largest tuna-importing regions (ASEAN, Japan, the Middle East, the EU, and US) at the HS (harmonized system) 06-digit levels, namely fresh or chilled tuna (0302:31, 32, 33, 34, 35, 35, 36, 39), frozen tuna (0303:41, 42, 43, 44, 45, 46, 49), filets (0304-87), and preserved tuna (1604:14). The study used the RCA and CMS approach to analyze data from 2007 to 2019.
Literature review
The economic literature focuses on the concept of comparative advantage, while the business literature has recently developed the concept of competitive advantage3, 5, 21. However, comparative advantage and competitiveness have many things in common 21. A country's comparative advantage makes it capable of creating more value in the long run than the products it produces, in which it lacks the comparative advantage. Thanks to comparative advantages, countries will generate higher profits and greater competitiveness21.
Several theories exist to elucidate the variables influencing the competitiveness of agricultural and agro-industrial product exports worldwide, including the Theory of Comparative Advantage, the Resource Endowment Theory, and the Theory of International Trade. The Heckscher-Ohlin-Samuelson theorem posits that countries will export goods that utilize the factor relatively more abundantly in their production, be it capital- or labor-intensive.
Many different methods are used across many fields to consider competitiveness. Comparative advantages such as revealed comparative advantage, constant market share, compound annual growth rate, trade competitiveness, trade intensity index, creation, and redirection index trade, revealed normalized comparative advantage approach had been used to analyze a country's competitiveness and examine competitiveness and trade structure of different economies and sectors in many industries.
The RCA index is a comprehensive and widely accepted measure in the literature to assess a country's export competitiveness in specific products 22. Balassa estimated the index of RCA to compare a country's specialization level and competitive position in exporting goods and services among major exporting countries in the world 23. The RCA index is calculated based on export performance and observed trade patterns24, providing insight into a country's comparative advantage from trade data 24.
The Constant Market Share model assumes that a country's export market share remains stable in the absence of external disruptions and if it maintains competitiveness in its home market. In contrast to traditional market share analysis, which compares a country's exports to the total imports of partner countries, the Constant Market Share (CMS) delves deeper, enabling researchers to isolate the factors driving export growth beyond global trends. The CMS model, introduced by Richardson, offers a framework for analyzing export performance 25. The CMS assesses competitiveness retrospectively, comparing a specific country's exports with global exports 26, 27. The CMS analysis categorizes export performance into four distinct effects: the impact of global economic growth, the influence of commodity composition, the effect of market distribution, and a residual competitiveness effect 28. Despite theoretical and empirical criticisms against the CMS approach, its popularity in international trade analysis persisted and was adjusted to analyze four effects of export performance in different contexts28. Integrating RCA and CMS methodologies offers significant advantages in analyzing a nation's export competitiveness in the tuna industry.
In the context of this research, utilizing both methods provides a comprehensive and insightful perspective on Vietnam's competitive landscape in the global market. Initially, the RCA method allows for a clear identification of Vietnam's comparative advantage in the tuna sector compared to other nations. It provides an overview of the comparative advantage of Vietnam's tuna exports based on the ratio between exports and production in a specific industry. It shows whether or not Vietnam has a competitive advantage in this industry. Then, based on each specific RCA index, the government can identify which tuna industry codes should be focused on investment and development. Subsequently, the CMS method aids in quantifying and evaluating Vietnam's ability to sustain its competitive advantage over time. By analyzing changes in Vietnam's export market share and the factors influencing it, CMS helps identify internal and market-driven factors that Vietnam needs to address to maintain and enhance its export competitiveness. Integrating data from both methodologies enables this study to identify and assess the factors influencing Vietnam's export competitiveness in the tuna industry, including productivity, product quality, and operational efficiency. Based on this analysis, the government and businesses can guide development policies for the industry by building competitive strategies, such as improving technology, improving product quality, and expanding markets. This contributes to enhancing Vietnam's position in the international market and positively impacts the sustainable development of the domestic tuna industry.
Methodology
Data collection
We determined the HS codes of tuna that have been exported around the world, including four significant codes: fresh or chilled tuna (0302:31, 32, 33, 34, 35, 35, 36, 39), frozen tuna (0303:41, 42, 43, 44, 45, 46, 49), fillets (0304:87), and preserved tuna (1604:14). The analysis used secondary data from the International Trade Centre database, the UNCTAD stat database. We selected five markets that considered the potential for exporting tuna, including the US, Japan, the EU, the Middle East, and ASEAN, from 2007 to 2019. In these five import markets, the group selects the typical countries for each group of tuna export capacity (e.g., in the EU, exporting countries like Vietnam, Ecuador, Thailand, and Indonesia). The team will rely on the above data to calculate the RCA and CMS of each country; each market is then combined with several factors and models for the conclusions.
The Revealed Comparative Advantage
Revealed Comparative Advantage (RCA) is commonly used to identify a particular country's export shift concerning its comparative advantage. RCA is one of the most prominent tools that allow effective measurement of competitiveness among industries (39), developed following the theory of trade for measuring a country's adeptness in exporting a particular commodity compared to a group of other countries18. CA has risen to prominence as a pivotal method for elucidating the intricate dynamics of international trade. By employing RCA computations, researchers and policymakers gain valuable insights into the structural shifts unfolding within a country's export sector over specific time intervals. RCA serves as a robust analytical framework, allowing for an in-depth exploration of the intricate relationship between a country's export performance in a particular commodity, its overall export portfolio, and the aggregate exports of that commodity across a diverse set of trading partners. Though numerous formulas devised by eminent scholars exist for computing the RCA index, we utilize the foundational formula articulated by Balassa for this study23. This formula, which serves as the cornerstone of our analysis, is shown in Figure 1.

The Balassa index (RCA)
Where:
X: Country i’s export of commodity j
X: Country i total commodities export to the world
X: Total import value/volume of commodity j in country m
X: Total import value/volume of country m.
With:
0 ≤ RCA ≤ 1: no comparative advantage
1 ≤ RCA ≤ 2: a low comparative advantage
2 ≤ RCA ≤ 4: an average comparative advantage
RCA > 4: a high comparative advantage
The Constant Market Share
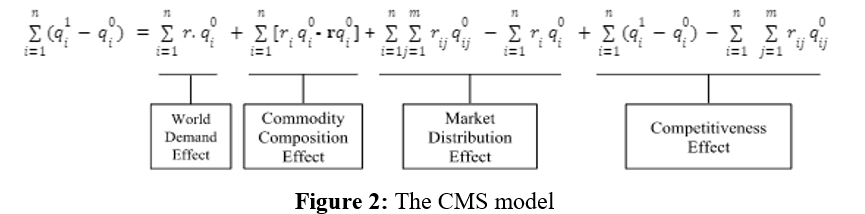
A country's exports can be classified by applying a constant market share (CMS) model by decomposing export growth into their respective parts (including the standard world growth effect, commodity composition effect, market distribution effect, and competition effect). Thus, the overall CMS identifies a fundamental change in the focus country's exports between the two periods and describes a country's export growth. The CMS model used in this study can be performed in Figure 2.

The CMS model
Where:
r: proportionate change in total world exports in aggregate from the initial period (0) to the terminal period (1);
r: proportionate change in world exports of the i^th commodity in aggregate from the initial period (0) to the terminal period (1);
r: proportionate change in world exports of commodity i, to market j in aggregate from the initial period (0) to terminal period (1);
: total exports by the focus country of commodity i in the initial period;
: total export by the focus country of commodity i, to the j^th market in the initial period;
: total export by the focus country of commodity i in the terminal period.
Results
Total HS Codes
Results from RCA
The competitiveness of tuna exports is determined using the RCA method, as shown in Table 1. RCA analysis shows Vietnam's moderate competitiveness in US tuna exports (average RCA 3.59). Although exports are growing, Vietnam's RCA to the US market is still low, while the RCA of competitors has no adverse fluctuations. This shows that the US market has become more open to tuna exporters.
In the Japanese market, Vietnam's RCA value, which is about three times smaller on average than in the US, has fluctuated around one and even below one after 2015. This suggests that Vietnam should have concentrated its tuna exports on other nations and regions with more significant potential than Japan.
In the EU market, Vietnam had a lower competitiveness than Thailand, Indonesia, and Ecuador (with RCA of 4.08, 15.61, 4.96, and 57.27, respectively). Vietnam's RCA value decreased gradually from 2012, reaching its bottom of 2.94 (2007-2019), and only recovered to 3.14 in 2019. This shows that Vietnam's competitiveness in tuna exports must still be fixed. Meanwhile, Ecuador's RCA value continuously increased, and the RCA values of Indonesia and Thailand fluctuated slightly. Interestingly, all the above countries had higher RCA values in the EU (during 2007-2019) than in the US. This reflects that they had a higher competitiveness level of tuna export to the EU than the US.
The tuna value of Vietnam's exports to the Middle East was small, but the average RCA value (4.08) was higher than that of the US. Besides, Thailand's competitor was highly competitive, with an average RCA index of 14.57. However, Vietnam and Thailand's RCA value in this market tended to decrease from 2013-2019, showing that Vietnam and Thailand reduced their priority for tuna exports.
The RCA value in the ASEAN market was even smaller than in the Middle East, with an average value of 1.85. Taipei (China) had a slight upward trend in RCA value, but its competitiveness was similar to Vietnam's. This shows that Vietnam had a low but stable competitiveness.
OverallRCA of Total Tuna Export to the US, Japan, EU, Middle East and ASEAN Market
|
Country/Year/Market |
2007 |
2008 |
2009 |
2010 |
2011 |
2012 |
2013 |
2014 |
2015 |
2016 |
2017 |
2018 |
2019 |
|
US | |||||||||||||
|
Vietnam |
4.36 |
3.44 |
3.04 |
4.05 |
4.01 |
4.14 |
3.99 |
3.79 |
3.57 |
3.33 |
3.08 |
2.80 |
3.08 |
|
Indonesia |
4.43 |
4.05 |
3.92 |
3.41 |
3.67 |
4.21 |
4.63 |
4.49 |
4.61 |
4.55 |
4.91 |
4.85 |
5.81 |
|
Ecuador |
41.24 |
48.19 |
36.51 |
30.49 |
42.27 |
41.86 |
52.64 |
53.49 |
53.98 |
60.75 |
74.32 |
69.01 |
65.86 |
|
Thailand |
15.59 |
18.14 |
14.76 |
13.77 |
15.33 |
13.73 |
14.19 |
13.80 |
12.64 |
12.38 |
11.32 |
11.42 |
11.90 |
|
Japan | |||||||||||||
|
Vietnam |
1.05 |
0.96 |
0.79 |
1.16 |
1.19 |
1.19 |
1.28 |
1.15 |
0.92 |
0.77 |
0.76 |
0.78 |
0.80 |
|
Thailand |
3.75 |
5.08 |
3.84 |
3.94 |
4.54 |
3.96 |
4.56 |
4.18 |
3.25 |
2.87 |
2.79 |
3.19 |
3.11 |
|
Taipei. China |
0.91 |
1.45 |
0.97 |
1.09 |
1.33 |
1.26 |
1.24 |
1.14 |
0.89 |
0.85 |
0.93 |
0.99 |
0.94 |
|
EU | |||||||||||||
|
Vietnam |
5.09 |
3.86 |
3.57 |
5.35 |
4.66 |
5.36 |
4.28 |
4.15 |
3.89 |
3.66 |
3.13 |
2.94 |
3.14 |
|
Indonesia |
5.17 |
4.54 |
4.60 |
4.51 |
4.26 |
5.45 |
4.97 |
4.91 |
5.03 |
5.00 |
4.99 |
5.09 |
5.92 |
|
Ecuador |
48.09 |
54.09 |
42.90 |
40.28 |
49.10 |
54.14 |
56.52 |
58.47 |
58.90 |
66.77 |
75.57 |
72.46 |
67.20 |
|
Thailand |
18.18 |
20.36 |
17.34 |
18.19 |
17.81 |
17.76 |
15.23 |
15.09 |
13.79 |
13.61 |
11.51 |
11.99 |
12.14 |
|
Middle East | |||||||||||||
|
Vietnam |
5.57 |
3.99 |
3.16 |
3.92 |
3.89 |
4.60 |
4.63 |
4.18 |
3.94 |
2.94 |
3.38 |
2.61 |
2.62 |
|
Thailand |
19.89 |
21.05 |
15.34 |
13.32 |
14.86 |
15.24 |
16.45 |
15.20 |
13.95 |
10.95 |
12.42 |
10.63 |
10.12 |
|
ASEAN | |||||||||||||
|
Vietnam |
1.75 |
1.21 |
1.46 |
1.96 |
1.74 |
2.05 |
2.03 |
2.34 |
2.55 |
1.75 |
1.62 |
1.62 |
1.91 |
|
Taipei. China |
1.52 |
1.82 |
1.78 |
1.84 |
1.95 |
2.17 |
1.96 |
2.32 |
2.48 |
1.92 |
1.99 |
2.04 |
2.23 |
|
Japan |
0.16 |
0.12 |
0.12 |
0.12 |
0.12 |
0.12 |
0.15 |
0.17 |
0.16 |
0.09 |
0.11 |
0.15 |
0.15 |
Results from CMS
CMS method further analyses Vietnam's tuna exports through global markets. As shown in Table 2, the standard world growth effect and commodity composition effect were the same in all markets and had positive values from 2007-2019. The Standard World Growth Effect value declined from period I-II and increased by 4.6 times after, showing that the influence of world demand increased strongly in Vietnam. The positive value of the commodity composition effect during 2007-2019 reflects the high market demand for this product.
Standard World Growth Effect and Commodity Composition Effect of Tuna in Total, Tuna 0302, 0303, 0304, and 1604
|
Period/Effect/Hs |
Standard World Growth Effect |
Commodity Composition Effect |
|
Total | ||
|
2007-2010 |
6456.50 |
103.81 |
|
2011-2014 |
3410.60 |
21841.84 |
|
2015-2019 |
15938.24 |
13618.69 |
|
0302 | ||
|
2007-2010 |
1554.30 |
-1490.15 |
|
2011-2014 |
665.88 |
-3644.96 |
|
2015-2019 |
338.62 |
-334.62 |
|
0303 | ||
|
2007-2010 |
593.40 |
-217.39 |
|
2011-2014 |
790.35 |
4912.00 |
|
2015-2019 |
1591.92 |
1441.13 |
|
0304 | ||
|
2012-2014 |
966.20 |
21766.89 |
|
2015-2019 |
6729.49 |
14993.96 |
|
1604 | ||
|
2007-2010 |
4308.79 |
2204.82 |
|
2011-2014 |
1954.37 |
10192.44 |
|
2015-2019 |
7278.20 |
6869.49 |
The market distribution effect reflects Vietnam's response to the increase in demand occurring in the importing country. Table 3, from 2007 to 2019, shows that Vietnam needed to allocate tuna exports to these markets properly. This may be because Vietnam focused on low-potential countries. Moreover, the market distribution effect decreased during three periods in the US, Japan, EU, and Middle Eastern markets. However, its value slightly increased in the ASEAN market from period II-III.
Market Distribution Effect of Tuna in Total, HS 0302, 0303, 0304, and 1604
|
Period/Market/Hs |
The US |
Japan |
The EU |
The Middle East |
The ASEAN |
|
Total | |||||
|
2007-2010 |
-2706.86 |
-5906.97 |
-6247.92 |
-5827.84 |
-2673.61 |
|
2011-2014 |
-13390.18 |
-23896.74 |
-21873.62 |
-23629.90 |
-26622.50 |
|
2015-2019 |
-16946.34 |
-29146.83 |
-22572.95 |
-27358.95 |
-17476.12 |
|
0302 | |||||
|
2007-2010 |
-967.63 |
34.08 |
-229.74 |
-63.11 |
1245.15 |
|
2011-2014 |
4775.57 |
1195.32 |
2979.00 |
3068.31 |
4395.13 |
|
2015-2019 |
198.58 |
-10.56 |
-1.26 |
-3.92 |
-12.48 |
|
0303 | |||||
|
2007-2010 |
-702.40 |
-210.87 |
-354.29 |
-140.11 |
395.13 |
|
2011-2014 |
-7354.81 |
-5856.73 |
-5507.23 |
-5320.82 |
-6139.34 |
|
2015-2019 |
1355.59 |
-3035.29 |
-2856.48 |
-3043.61 |
-414.95 |
|
0304 | |||||
|
2012-2014 |
-26356.41 |
-23208.78 |
-21855.30 |
-22658.07 |
-19562.92 |
|
2015-2019 |
-12734.51 |
-20920.65 |
-13636.52 |
-20041.58 |
1239901.93 |
|
1604 | |||||
|
2007-2010 |
-2335.88 |
-5792.74 |
-6064.14 |
-5942.93 |
1077.08 |
|
2011-2014 |
-10369.31 |
-12142.59 |
-9859.14 |
-10984.93 |
-10373.82 |
|
2015-2019 |
-9460.01 |
-13693.32 |
-10909.03 |
-12645.35 |
56480.21 |
Lastly, the Competitiveness Effect was positive for five markets from 2007-2019. This shows that Vietnam focused on increasing the value and quality of exported tuna. In addition, this value tended to increase sharply in periods I-II and decreased slightly then. This proves Vietnam improved its tuna quality to meet the needs of the importing countries (see Table 4).
Competitiveness Effect of Tuna in Total, HS 0302, 0303, 0304, and 1604
|
Period/Market/Hs |
The US |
Japan |
The EU |
The Middle East |
The ASEAN |
|
Total | |||||
|
2007-2010 |
77017.55 |
80217.67 |
80558.62 |
80138.53 |
76984.30 |
|
2011-2014 |
173533.75 |
184040.00 |
182017.18 |
183773.46 |
186766.06 |
|
2015-2019 |
168146.41 |
180346.90 |
173773.02 |
178559.02 |
168676.19 |
|
0302 | |||||
|
2007-2010 |
10382.48 |
9380.77 |
9644.59 |
9477.96 |
8169.70 |
|
2011-2014 |
-33610.49 |
-30030.00 |
-31813.92 |
-31903.22 |
-33230.05 |
|
2015-2019 |
-6389.59 |
-6180.45 |
-6189.74 |
-6187.08 |
-6178.53 |
|
0303 | |||||
|
2007-2010 |
39756.39 |
39264.85 |
39408.28 |
39194.10 |
38658.86 |
|
2011-2014 |
-36488.54 |
-37987.00 |
-38336.13 |
-38522.53 |
-37704.01 |
|
2015-2019 |
-9073.64 |
-4682.76 |
-4861.58 |
-4674.45 |
-7303.10 |
|
0304 | |||||
|
2012-2014 |
105834.31 |
102687.00 |
101333.20 |
102135.97 |
99040.82 |
|
2015-2019 |
132123.05 |
140309.20 |
133025.06 |
139430.13 |
-1120513.39 |
|
1604 | |||||
|
2007-2010 |
27784.27 |
31241.13 |
31512.54 |
31391.32 |
24371.31 |
|
2011-2014 |
77759.49 |
79533.00 |
77249.32 |
78375.12 |
77764.01 |
|
2015-2019 |
45829.32 |
50062.63 |
47278.34 |
49014.66 |
-20110.90 |
Results from Detailed HS Codes
0302
Results from RCA
Table 5 shows that, because of the highest RCA value, Vietnam's comparative advantage was highest in the US in 2007. However, from 2008-2012, Ecuador increased (average RCA value of 7.71), while Vietnam decreased with an average RCA value of 4.42. This shows that Vietnam gradually lost its comparative advantage over its rivals. Then, after 2015, the RCA value was under 1. This reflects that Vietnam had no comparative advantage since 2015.
Table 5 shows that the RCA value of Vietnam’s 0302 tuna in Japan was generally smaller than in the US market. Moreover, only in 2007, 2011, and 2012 was the RCA value of Vietnam higher than 1, while the RCA value of Thailand was lower than 1 for 13 years.
Besides, Vietnam's RCA value was higher in the EU than in the US. From 2007-2012, Vietnam had a high comparative advantage in exporting 0302 tuna, with an average RCA value of 22,30. However, from 2013, Vietnam's RCA value decreased sharply; after 2016, this value was lower than 1 (see Table 5). While Indonesia's RCA value also decreased, it still maintained an average comparative advantage, and Ecuador owned the highest comparative advantage
In the Middle East and ASEAN markets, as shown in Table 5, during 2007-2012, with average RCA values of 61.09 and 27.26, respectively, Vietnam had a higher comparative advantage than the EU market. However, there was a downward trend after 2012. Meanwhile, in the ASEAN market, Taipei (China), with a lower comparative advantage from 2007, became a powerful competitor (8.71 of RCA value in 2019). This shows that Vietnam lost its competitiveness.
In conclusion, Vietnam's competitiveness in exporting 0302 tuna declined significantly after 2012. By 2016-2019, Vietnam lost its advantage, especially in the US and Japanese markets. This indicates Vietnam shifted focus away from this tuna product while competitors like Ecuador and Taipei (China) capitalized on the market.
RCA of Tuna 0302 Export to the US, Japan, EU, Middle East and ASEAN Market
|
Country/Year/Market |
2007 |
2008 |
2009 |
2010 |
2011 |
2012 |
2013 |
2014 |
2015 |
2016 |
2017 |
2018 |
2019 |
|
US | |||||||||||||
|
Vietnam |
5.01 |
2.79 |
4.02 |
4.87 |
5.01 |
5.44 |
2.08 |
1.10 |
0.48 |
0.09 |
0.14 |
0.12 |
0.10 |
|
Indonesia |
0.00 |
0.00 |
0.00 |
0.00 |
0.00 |
0.00 |
0.00 |
0.00 |
0.00 |
0.00 |
0.00 |
0.00 |
0.00 |
|
Ecuador |
3.05 |
5.85 |
9.47 |
8.09 |
6.66 |
8.50 |
8.66 |
4.82 |
7.56 |
8.42 |
6.97 |
9.89 |
9.74 |
|
Thailand |
0.76 |
0.43 |
0.51 |
0.55 |
0.37 |
0.32 |
0.77 |
1.03 |
0.97 |
0.88 |
0.18 |
0.06 |
0.04 |
|
Japan | |||||||||||||
|
Vietnam |
1.07 |
0.63 |
0.70 |
0.99 |
1.19 |
1.33 |
0.65 |
0.41 |
0.19 |
0.03 |
0.06 |
0.06 |
0.06 |
|
Thailand |
0.16 |
0.10 |
0.09 |
0.11 |
0.09 |
0.08 |
0.24 |
0.38 |
0.39 |
0.30 |
0.08 |
0.03 |
0.02 |
|
Tabei. China |
0.05 |
0.84 |
0.63 |
1.27 |
1.63 |
1.67 |
1.93 |
1.84 |
1.49 |
1.26 |
1.28 |
1.06 |
0.73 |
|
EU | |||||||||||||
|
Vietnam |
23.31 |
15.77 |
20.09 |
26.62 |
22.18 |
25.83 |
10.10 |
5.20 |
2.11 |
0.35 |
0.52 |
0.49 |
0.41 |
|
Indonesia |
29.28 |
37.77 |
30.16 |
33.56 |
18.33 |
15.97 |
16.40 |
14.41 |
9.45 |
9.37 |
4.84 |
3.27 |
2.77 |
|
Ecuador |
14.21 |
33.11 |
47.35 |
44.18 |
29.49 |
40.38 |
41.99 |
22.72 |
33.57 |
34.31 |
25.93 |
39.60 |
39.22 |
|
Thailand |
3.56 |
2.46 |
2.55 |
3.00 |
1.65 |
1.50 |
3.72 |
4.86 |
4.32 |
3.60 |
0.67 |
0.22 |
0.14 |
|
Middle East | |||||||||||||
|
Vietnam |
77.21 |
46.79 |
54.60 |
62.05 |
72.92 |
52.97 |
12.38 |
8.44 |
3.51 |
0.93 |
1.48 |
1.06 |
0.76 |
|
Thailand |
1.33 |
0.18 |
0.03 |
0.00 |
0.00 |
0.00 |
0.00 |
4.98 |
1.55 |
0.00 |
0.00 |
0.00 |
0.00 |
|
ASEAN | |||||||||||||
|
Vietnam |
37.10 |
25.47 |
24.21 |
20.56 |
28.57 |
27.68 |
16.73 |
7.15 |
2.01 |
0.43 |
0.64 |
0.90 |
0.63 |
|
Taipei, China |
1.63 |
33.78 |
21.72 |
26.22 |
39.38 |
34.73 |
49.65 |
32.44 |
15.69 |
18.83 |
13.17 |
16.02 |
8.17 |
|
Japan |
1.96 |
2.42 |
1.88 |
1.04 |
1.79 |
1.41 |
1.62 |
1.67 |
0.99 |
1.00 |
1.01 |
1.87 |
1.74 |
Results from CMS
Table 2 shows that the standard world growth effect had a positive value from 2007-2019. This reflects that the effect of world demand put pressure on Vietnam's 0302 tuna exports. Moreover, this value declined significantly, showing that the world's 0302 tuna consumption continued to increase. The negative value of the Commodity Composition Effect during 2007-2019 reflects that consumers worldwide did not favor Vietnamese 0302 tuna exports. From period I-II, this value fluctuated but was still negative.
The market distribution effect of all five markets had positive values in period II, while periods I and III were unstable (increasing in I-II, decreasing in II-III). This shows that Vietnam properly distributed 0302 tuna in these markets in period II (see Table 3).
Table 4 shows that although the competitiveness effect had different values in each market, it tended to remain the same. In period I, the positive value shows that Vietnam focused on increasing the value of 0302 tuna exports. This effect decreased sharply from period I-II and increased slightly from period II-III.
0303
Result from RCA
Table 6 shows that Vietnam was the third country with a comparative advantage when exporting this code to the US at a 3.07 average. Meanwhile, Indonesia and Ecuador had higher average values (8.39 and 13.93, respectively). Vietnam's exports of 0303 tuna generally showed a downward trend, especially from 2012-2014 and 2016-2019.
Table 6 shows that the RCA of 0303 tuna in the EU market is higher than in the US (3.78) but significantly lower than in Ecuador (18.40). Moreover, Vietnam's declining RCA, particularly during 2015-2018, shows that Vietnam needs to focus on exporting this product code.
As shown in Table 6, Vietnam lost its comparative advantage with an average RCA value of 0.21. However, Taipei's biggest market rival also held a low average RCA value. The RCA of Vietnam in the Japanese market increased slightly while it decreased in ASEAN. This reflects that Vietnam could have improved its comparative advantage in these markets.
Table 6 shows Vietnam has a comparative advantage in the Middle East (average RCA value of 3.59). Despite solid potential in this market, Vietnam's exports have declined since 2012.
In conclusion, the RCA value in 0303 tuna declined significantly across all markets, suggesting a shift in focus away from this product. This is especially evident in the Middle East, where Vietnam needed more competitiveness. Meanwhile, competitors like Ecuador held a significant advantage in key markets like the EU.
RCA of Tuna 0303 Export to the US, Japan, EU, Middle East and ASEAN Market
|
Country/Year/Market |
2007 |
2008 |
2009 |
2010 |
2011 |
2012 |
2013 |
2014 |
2015 |
2016 |
2017 |
2018 |
2019 |
|
US | |||||||||||||
|
Vietnam |
1.90 |
1.64 |
1.89 |
6.15 |
5.90 |
4.61 |
2.12 |
1.28 |
2.22 |
1.73 |
1.56 |
1.04 |
7.83 |
|
Indonesia |
4.27 |
4.75 |
4.15 |
4.76 |
6.13 |
10.75 |
9.55 |
7.37 |
5.89 |
5.19 |
8.71 |
4.89 |
32.71 |
|
Ecuador |
4.03 |
11.11 |
20.05 |
20.11 |
22.11 |
7.20 |
10.47 |
14.39 |
8.30 |
5.69 |
15.50 |
18.44 |
23.72 |
|
Thailand |
1.83 |
2.50 |
2.01 |
0.97 |
1.61 |
1.91 |
0.65 |
0.94 |
0.81 |
0.90 |
1.68 |
1.46 |
7.76 |
|
Japan | |||||||||||||
|
Vietnam |
0.15 |
0.13 |
0.15 |
0.44 |
0.43 |
0.37 |
0.23 |
0.12 |
0.21 |
0.15 |
0.14 |
0.11 |
0.14 |
|
Thailand |
0.15 |
0.20 |
0.16 |
0.07 |
0.12 |
0.15 |
0.07 |
0.09 |
0.08 |
0.08 |
0.15 |
0.16 |
0.14 |
|
Taipei. China |
1.42 |
2.07 |
1.35 |
1.25 |
1.56 |
2.21 |
2.36 |
1.92 |
1.69 |
1.58 |
1.87 |
2.31 |
2.36 |
|
EU | |||||||||||||
|
Vietnam |
3.63 |
2.70 |
3.69 |
10.39 |
7.92 |
5.62 |
2.60 |
1.77 |
3.51 |
2.26 |
1.86 |
1.37 |
1.78 |
|
Indonesia |
8.17 |
7.84 |
8.08 |
8.05 |
8.23 |
13.10 |
11.74 |
10.17 |
9.32 |
6.77 |
10.41 |
6.49 |
7.43 |
|
Ecuador |
7.72 |
18.34 |
39.07 |
33.99 |
29.69 |
8.77 |
12.87 |
19.87 |
13.14 |
7.41 |
18.51 |
24.47 |
5.39 |
|
Thailand |
3.49 |
4.13 |
3.92 |
1.63 |
2.16 |
2.33 |
0.79 |
1.30 |
1.29 |
1.17 |
2.00 |
1.94 |
1.76 |
|
Middle East | |||||||||||||
|
Vietnam |
3.59 |
3.90 |
3.03 |
5.66 |
6.97 |
7.14 |
2.73 |
1.17 |
2.61 |
1.54 |
1.71 |
1.54 |
1.61 |
|
Thailand |
3.45 |
5.95 |
3.22 |
0.89 |
1.90 |
2.97 |
0.83 |
0.86 |
0.96 |
0.79 |
1.84 |
2.17 |
1.60 |
|
ASEAN | |||||||||||||
|
Vietnam |
0.17 |
0.11 |
0.17 |
0.51 |
0.44 |
0.32 |
0.17 |
0.13 |
0.24 |
0.16 |
0.14 |
0.10 |
0.12 |
|
Taipei. China |
1.56 |
1.69 |
1.57 |
1.44 |
1.61 |
1.93 |
1.68 |
2.10 |
1.90 |
1.65 |
1.89 |
2.05 |
2.11 |
|
Japan |
0.14 |
0.10 |
0.09 |
0.10 |
0.10 |
0.09 |
0.13 |
0.14 |
0.10 |
0.05 |
0.08 |
0.11 |
0.09 |
Results from CMS
Table 2 shows that Vietnam's standard world growth effect value increased significantly. This means that the demand for 0303 tuna decreased. Besides, for the commodity composition effect, from period I-II, its value increased sharply, but when entering period III, it started to decrease.
Table 3 shows that the market distribution effect fluctuates strongly. In most markets, its value was negative from 2007-2018. Moreover, regarding the Competitiveness Effect (see Table 4), there was a fluctuant trend during three periods in all markets. This shows that the quality of this HS code from Vietnam needed to be guaranteed.
0304
For 0304 tuna, in 2012, Vietnam started exporting to all five markets. Therefore, this study analyses the factors affecting Vietnam's competitiveness in the 2012-2014 and 2015-2019 periods.
Result from RCA
Table 7 shows that, in the US, Vietnam had a comparative advantage, and Vietnam's RCA value was the highest. Regarding export value, most countries had an increasing trend. Vietnam had the fastest growth rate, but the RCA value fluctuated. This shows that the US market was losing interest in Vietnamese tuna code 0304.
As shown in Table 7, in the EU, Vietnam's RCA index was the highest (average value of 28.45). However, RCA value decreased slightly while Vietnam's market share in the EU increased. Vietnam should maintain the competitiveness of tuna code 0304 in this market.
Table 7 shows that Vietnam retains a comparative advantage for tuna code 0304 in the Japanese market (average RCA of 1.16). Meanwhile, Thailand and Taipei did not have a comparative advantage in this market (average RCA of 0.13 and 0.03, respectively). Additionally, along with the increase in export value, the RCA also increased simultaneously. This means that Vietnam focused more on exporting tuna code 0304 to this market.
In the Middle East and ASEAN markets, Vietnam's 0304 tuna fluctuated strongly between 2012 and 2019, reaching a high RCA value of 64.01 and 51.89, respectively. Although rival countries also had RCA values > 1, their export values tended to fluctuate or even decrease. It can be concluded that Vietnam's comparative advantage in these two markets was quite high and relatively stable (see Table 7).
In conclusion, from 2012 to 2019, Vietnam dominated the export of 0304 tuna in all five markets, with a consistently high RCA value, showcasing it as a priority product for export.
RCA of Tuna 0304 Export to the US, Japan, EU, Middle East and ASEAN Market
|
Country/Year/Market |
2007 |
2008 |
2009 |
2010 |
2011 |
2012 |
2013 |
2014 |
2015 |
2016 |
2017 |
2018 |
2019 |
|
US | |||||||||||||
|
Vietnam |
- |
- |
- |
- |
- |
5.13 |
10.31 |
12.18 |
8.87 |
7.65 |
7.37 |
7.36 |
6.67 |
|
Indonesia |
- |
- |
- |
- |
- |
0.00 |
0.00 |
0.00 |
0.00 |
0.00 |
0.00 |
0.00 |
0.00 |
|
Ecuador |
- |
- |
- |
- |
- |
- |
2.59 |
5.09 |
7.50 |
9.67 |
7.90 |
5.68 |
6.37 |
|
Thailand |
- |
- |
- |
- |
- |
0.00 |
0.76 |
1.09 |
1.18 |
1.13 |
0.66 |
0.63 |
0.51 |
|
Japan | |||||||||||||
|
Vietnam |
- |
- |
- |
- |
- |
0.82 |
1.29 |
1.73 |
1.18 |
1.11 |
1.02 |
1.06 |
1.10 |
|
Thailand |
- |
- |
- |
- |
- |
0.19 |
0.10 |
0.15 |
0.16 |
0.16 |
0.09 |
0.09 |
0.08 |
|
Taipei. China |
- |
- |
- |
- |
- |
0.00 |
0.00 |
0.01 |
0.03 |
0.04 |
0.05 |
0.06 |
0.05 |
|
EU | |||||||||||||
|
Vietnam |
- |
- |
- |
- |
- |
25.45 |
40.46 |
42.92 |
31.30 |
23.57 |
20.97 |
21.09 |
21.87 |
|
Ecuador |
- |
- |
- |
- |
- |
0.00 |
10.15 |
17.94 |
26.49 |
29.77 |
22.45 |
16.28 |
20.87 |
|
Thailand |
- |
- |
- |
- |
- |
5.90 |
2.99 |
3.84 |
4.18 |
3.47 |
1.87 |
1.81 |
1.69 |
|
Indonesia |
- |
- |
- |
- |
- |
10.61 |
12.34 |
19.91 |
16.05 |
13.46 |
10.83 |
21.02 |
22.83 |
|
Middle East | |||||||||||||
|
Vietnam |
- |
- |
- |
- |
- |
42.76 |
59.73 |
84.16 |
81.89 |
76.84 |
56.88 |
56.35 |
56.63 |
|
Thailand |
- |
- |
- |
- |
- |
9.92 |
4.41 |
7.54 |
10.94 |
11.32 |
- |
4.85 |
4.37 |
|
ASEAN | |||||||||||||
|
Vietnam |
- |
- |
- |
- |
- |
42.24 |
74.82 |
54.70 |
29.24 |
35.60 |
66.59 |
57.90 |
54.01 |
|
Taipei. China |
- |
- |
- |
- |
- |
0.00 |
0.01 |
0.47 |
0.68 |
1.18 |
3.44 |
3.29 |
2.49 |
|
Japan |
- |
- |
- |
- |
- |
1.66 |
1.32 |
0.73 |
0.49 |
0.56 |
1.27 |
1.03 |
1.28 |
Results from CMS
Table 2 shows that the standard world growth effect value for 0304 tuna increased considerably. This shows that total market demand decreased significantly, which contributed to reducing negative pressure on exporters. Besides, the Commodity Composition Effect value decreased from II-III. This reflects that consumer interest in this tuna code dropped.
Table 3 shows that Vietnam's market distribution factor for exporting tuna 0304 showed positive growth in all markets except the ASEAN market. The factor increased slightly from 2011-2014 to 2015-2019, indicating Vietnam's efforts in resource allocation. The ASEAN market showed a negative and decreasing market distribution factor, requiring improvement from Vietnam.
Table 4 shows that the competitiveness effect factor for 0304 tuna in the ASEAN market declined while other markets have slightly improved. This may show that the quality of Vietnamese tuna filets exported to ASEAN was not rated higher than in other regions.
1604
Results from RCA
Table 8 shows that, in the US market, Vietnam's RCA index averaged 3.34. Equivalent to Vietnam, Indonesia also owned an RCA value of around 4.09. However, the RCA values of Ecuador and Thailand were even higher, at 84.48 and 22.82, respectively. This means that Vietnam had a comparative advantage but encountered strong competitors.
From Table 8, the export value of Vietnamese 1604 tuna tended to increase in the US market. However, the RCA value showed a downward trend, which means that this product should be focused more despite being exported more.
Moreover, in the EU market, Vietnam's RCA index averaged 3.43. While Ecuador - the strongest competitor - had an average value of 66.54. Furthermore, with RCA around 18.7, Thailand was also a strong opponent for Vietnam. Besides showing an upward trend in export value, only Ecuador's RCA showed growth, while Vietnam did not.
From Table 8, in the Japanese and The Middle East, for 1604 tuna, Vietnam retained 3.66 and 2.51 in RCA average, respectively. Meanwhile, the competitor - Thailand, had a higher comparative advantage with 24.5 and 16.83. In addition, the export value from Vietnam and Thailand fluctuated while the RCA of both countries decreased. This shows that this product was gradually no longer receiving priority from those two countries.
Table 8 illustrates that, in the ASEAN market, Vietnam had the highest RCA for 1604 tuna, with an average value of 26.09. Meanwhile, other opponents like Taipei and Japan's RCA only reached 0.01 and 0.1. In terms of value, there were periods of rapid increase. However, the RCA value showed a downward trend, making Vietnam's competitiveness unstable.
Vietnam's competitiveness in exporting tuna code 1604 remained stable but lagged behind major competitors like Ecuador and Thailand. While export value decreased in most markets, Vietnam maintained its position in ASEAN but needs to improve its efforts to exploit this code's potential fully.
RCA of Tuna 1604 Exports to the US, Japan, EU, Middle East and ASEAN Market
|
Country/Year/Market |
2007 |
2008 |
2009 |
2010 |
2011 |
2012 |
2013 |
2014 |
2015 |
2016 |
2017 |
2018 |
2019 |
|
US | |||||||||||||
|
Vietnam |
5.03 |
4.11 |
3.09 |
3.36 |
3.35 |
3.54 |
3.69 |
3.34 |
3.19 |
3.29 |
2.89 |
2.42 |
2.17 |
|
Indonesia |
3.82 |
3.14 |
3.28 |
2.45 |
2.99 |
3.50 |
4.06 |
3.89 |
5.00 |
5.17 |
5.24 |
5.08 |
5.56 |
|
Ecuador |
68.63 |
69.85 |
48.43 |
38.27 |
55.01 |
66.14 |
81.83 |
85.73 |
98.29 |
118.25 |
136.25 |
123.22 |
108.29 |
|
Thailand |
25.97 |
27.24 |
22.16 |
19.95 |
21.89 |
22.03 |
22.91 |
22.92 |
23.80 |
24.81 |
21.43 |
21.40 |
20.15 |
|
Japan | |||||||||||||
|
Vietnam |
5.40 |
4.40 |
3.55 |
4.94 |
4.31 |
4.52 |
4.58 |
4.16 |
3.00 |
2.49 |
2.27 |
2.03 |
1.88 |
|
Thailand |
27.92 |
29.10 |
25.47 |
29.33 |
28.14 |
28.17 |
28.43 |
28.57 |
22.40 |
18.77 |
16.88 |
17.93 |
17.48 |
|
Taipei. China |
0.00 |
0.00 |
0.00 |
0.01 |
0.00 |
0.00 |
0.00 |
0.00 |
0.00 |
0.00 |
0.00 |
0.00 |
0.00 |
|
EU | |||||||||||||
|
Vietnam |
4.15 |
3.54 |
2.75 |
3.60 |
3.24 |
3.48 |
2.95 |
2.62 |
2.23 |
2.32 |
1.96 |
1.70 |
1.65 |
|
Ecuador |
56.62 |
60.06 |
43.17 |
41.05 |
53.29 |
65.04 |
65.40 |
67.40 |
68.61 |
83.22 |
92.71 |
86.30 |
82.14 |
|
Thailand |
21.43 |
23.42 |
19.75 |
21.40 |
21.21 |
21.66 |
18.31 |
18.02 |
16.61 |
17.46 |
14.58 |
14.99 |
15.28 |
|
Indonesia |
3.15 |
2.70 |
2.92 |
2.62 |
2.90 |
3.44 |
3.24 |
3.06 |
3.49 |
3.64 |
3.56 |
3.56 |
4.22 |
|
Middle East | |||||||||||||
|
Vietnam |
4.42 |
3.43 |
2.38 |
2.69 |
2.59 |
2.70 |
3.15 |
2.74 |
2.23 |
1.74 |
2.00 |
1.34 |
1.24 |
|
Thailand |
22.84 |
22.68 |
17.08 |
16.00 |
16.93 |
16.84 |
19.58 |
18.83 |
16.66 |
13.07 |
14.89 |
11.87 |
11.52 |
|
ASEAN | |||||||||||||
|
Vietnam |
39.27 |
19.78 |
21.00 |
25.49 |
14.38 |
12.76 |
15.01 |
14.15 |
9.80 |
8.20 |
11.32 |
8.21 |
6.60 |
|
Taipei. China |
0.03 |
0.01 |
0.02 |
0.03 |
0.01 |
0.01 |
0.01 |
0.01 |
0.01 |
0.01 |
0.01 |
0.01 |
0.01 |
|
Japan |
0.23 |
0.13 |
0.22 |
0.19 |
0.11 |
0.07 |
0.11 |
0.09 |
0.08 |
0.09 |
0.10 |
0.10 |
0.09 |
Results from CMS
Table 2 reveals fluctuating global demand for Vietnam's 1604 tuna. The decreasing standard world growth effect in stages I-II suggests rising export pressure, while its subsequent rise in II-III indicates improved export opportunities. Similarly, the commodity composition effect reflects rising Vietnamese product preference in I-II and declining consumer interest in II-III.
Table 3 shows negative market distribution (except ASEAN) across all periods, highlighting the need for Vietnam to optimize resource allocation. While ASEAN distribution was favorable in stages I and III (indicating rational allocation), the shift to negative in phase II suggests ongoing limitations in Vietnamese distribution strategies.
From Table 4, the Competitiveness Effect of Vietnam's 1604 tuna in all five markets was up in Phase I-II and down in Phase II-III. Except for the ASEAN market, the value of the competition effect in all countries was positive, which means that the quality of this product improved significantly. However, in the ASEAN market, in period III, the quality was significantly reduced.
Discussion
Main findings
Our research determines Vietnam's tuna industry's current position and competitiveness in major import markets (US, Japan, the EU, the Middle East, and ASEAN) with significant competitors (Indonesia, Ecuador, Thailand, and Taipei - China) at four detailed industry codes, namely fresh or chilled tuna (0302:31, 32, 33, 34, 35, 35, 36, 39), frozen tuna (0303:41, 42, 43, 44, 45, 46, 49), fillets (0304-87), and preserved tuna (1604:14), using RCA and CMS approaches from 2007-2019. Specifically, the comparative advantage of tuna filets increased in all five markets, but it was accompanied by a gradual decline in fresh tuna (0302). On the contrary, frozen tuna (0303) experienced significant fluctuations across different periods. Despite growing consumer interest globally, ensuring adequate production volume and quality remains crucial. Vietnam has primarily concentrated on improving the distribution of frozen tuna within the ASEAN market, necessitating a more balanced distribution across other markets.
With 0304 tuna in all five markets from 2012 to 2019, Vietnam always had the highest RCA index compared to rival countries. For the Market Distribution factor, except for the ASEAN market, there was a positive growth in resource allocation when exporting tuna 0304, reaching a positive value during 2015-2019. While the ASEAN market decreased in 2 periods, the value of competitive impact increased slightly in other markets.
For the prepared or preserved tuna product (1604), its comparative advantage in the US, Japan, EU, and Middle East markets was average and tended to decrease. Only in the ASEAN market did Vietnam have a relatively high comparative advantage. This was due to the fluctuating global demand for this industry, and Vietnam tried to distribute canned tuna products more rationally, focusing on the ASEAN market rather than other markets.
A comparison with critical competitors shows that Vietnam's level of competitiveness is similar due to the influence of resources, market demand, and technological capacity19, 20. The RCA indicators of Thailand's tuna exports' competitiveness for 1996–2006 show that Thailand possesses significant advantages in all key export markets, which have remained consistent in the USA, the Middle East, and Japan 29. The relative revealed comparative trade advantage index results indicate that Indonesia has a tremendous or positive index value in all three main markets of Indonesian tuna products, including Japan, the United States, and Thailand, from 2001-2016. Specifically, the RCA analysis revealed that three types of Indonesian tuna commodities, HS 0302032, 0302033, and 0302034, exhibited comparative competitiveness. Each variety of tuna fish holds a nearly equal market share, with Japan being the dominant consumer.
Theoretical contributions
In this study, we assess the competitiveness of the Tuna Vietnam fishery industry at the HS (harmonized system) 06-digit levels, using RCA and CMS approaches, providing insightful results in critical markets against key competitors. Export competitiveness is essential to a country's global success 3. Researchers in this field have engaged in ongoing discussions in scholarly publications 2, 5, 6. The EC inspection covered economies as diverse as India, China, and Indonesia. Additionally, it has been explored in ASEAN countries and other countries such as Ghana, the United States, Singapore, and Japan. It is important to note that most of these studies are conducted in diverse industrial sectors, such as the currency markets, agricultural exports, chemicals, electrical machinery, and transportation equipment. Besides, previous studies tend to evaluate the industry's overall competitiveness while ignoring the more specific picture of each sub-sector with its dominant resource requirements and different market attractiveness. The separate use of EC assessment scales can lead to biased results, requiring simultaneous use of scales for comprehensive assessment and critical comparison between results. Finally, the tuna industry plays a vital role in the world fisheries value chain, and the EC will promote its sustainable development.
Policy implications
Vietnam holds a competitive edge in tuna exports to key markets. Strategic policy recommendations are necessary to maintain this position and ensure sustainable industry growth. As mentioned above, code 0304 has a higher comparative advantage than code 0302. Therefore, the Vietnamese government must advocate for appropriate policies for both industry codes to ensure sustainable development. For code 0304, the government needs to encourage businesses to invest more in modern processing technologies and IoT applications in the processing process. These improvements can enhance product quality, elevating code 0304 as Vietnam's primary tuna export. The government should also encourage businesses to adopt digital transformation in automated fish classification and utilize sensors and IoT to monitor storage conditions to maintain fish freshness. Vietnam's Illegal, unreported, and unregulated fishing (IUU) yellow card undermines the competitiveness of the seafood industry, especially in the EU. Immediate action is necessary to improve fishermen's skills and knowledge of standard fishing practices. In addition, the Government of Vietnam will implement a system that aggregates data on fishermen's fishing logs to provide accurate statistical data and timely policies to ensure biological populations, especially tuna. Finally, the government should have support for technological equipment as well as patrol teams to support fishermen in case of emergency to ensure supply. In addition, the Vietnamese government needs to implement measures to ensure a reasonable and optimized allocation of export value among markets. To have a better understanding of imported countries, Vietnam should collect and analyze data regularly so that they can update logistic trends in the world.
Conclusion, limitations, and future research direction
Vietnam's tuna industry has become essential to the global value chain. After analyzing RCA from 2007-2019, Vietnam needed a comparative advantage in the Japanese market. Meanwhile, Vietnam held certain comparative advantages over time with the other four markets. However, these values showed a downward trend in all markets and the downturn of the four codes. Primarily, only tuna with code 0304 was the product that became more precious. Then, based on CMS analysis for each detailed code and the whole tuna industry in 3 periods, including 2007-2010, 2011-2014, and 2015-2019, it shows that Vietnam had improved the quality of exported tuna (especially code 0304) to meet the needs of markets and Vietnam tuna was more popular with consumers around the world, especially in codes 0304 and 1604. However, Vietnam needed to properly allocate the tuna industry and specific groups of tuna to each market. Finally, the study has recommended various measures such as changing from exploitation, processing, preservation, and boosting product quality to distribution for each tuna industry code and the whole tuna industry.
Despite efforts to better the study, some limitations still exist. The first is a methodological limitation. Because only two main models are used, RCA and CSM, the study has yet to provide an in-depth analysis of the root causes for the decline of Vietnam's competitive advantage. Second, the study has yet to consider other sectors that use the same resources as tuna. In order to gain a deeper insight into the assessment of Vietnam's fishery export industry, future studies can exploit the following recommendations. The first may be using different supportive models to analyze the factors affecting the RCA and CMS models, such as the FsQCA model. Besides, the research subject is focused on the tuna industry and can be extended to other industries that apply the same resources as tuna.
ABBREVIATIONS
CMS: Constant Market Share
EC: Export competitiveness
IUU: Unreported and unregulated fishing IUU
RCA: Revealed Comparative Advantage
CONFLICT OF INTEREST
The authors declare that they have no conflicts of interest
AUTHORS’ CONTRIBUTIONS
All authors have contributed equally to the work.